- EJPPS

- Jan 4, 2023
- 16 min read
Updated: Jan 24, 2023
Peer Review Article | Open Access | Published 4th January 2023
Validation of Blue Light Imaging Technology for the Detection of Viable Microcolonies
Johannes Oberdoerfer, Jamie Brosseau and David L. Jones - Rapid Micro Biosystems Inc., Lowell, Massachusetts, USA | EJPPS | 274 (2022) | https://doi.org/10.37521/ejpps.27403| Click to download pdf
Abstract
The possibilities and simplicity of visual colony counting have made it the mainstay of microbiological analysis for more than a hundred years. A main disadvantage of the method is the long time required to generate visible colonies from microbes in a sample. New technologies and automation have emerged in recent years to challenge this mainstay of microbiological analysis. Among these new technologies, the Growth Direct® System uses digital imaging of cellular autofluorescence to detect and enumerate growing microcolonies many generations before they become visible to the human eye by using blue light to excite microbes to autofluorescence. There may be concerns, however, that viable microcolonies are damaged or killed by the energy they are exposed to during excitation. To show that the amount of energy generated by the Growth Direct® System does not have any negative effect on viable microcolonies, four different test series have been prepared and compared to each other. The novel technology was described, and the testing performed which determined that the enumeration by the Growth Direct® System was accurate and did not affect the viable microcolonies using blue light illumination.
Key words: Growth Direct®, colony counter, automation, blue light, validation
1. Introduction
The goal of the validation is to evaluate that an automated colony counter (Growth Direct® System) can accurately enumerate colonies on a growth medium by using blue light excitation without interfering or having a negative effect on viable microcolonies. It is known that light with a lower wavelength and therefore higher energy level could possibly harm, damage or kill viable microcolonies, depending on the time and intensity of exposure. As the Growth Direct® System automated colony counter uses blue light to cause viable microcolonies to autofluorescence and thus count these colonies, it is necessary to show and prove that no negative effect on viable microcolonies occurs during exposure of media plates.
1.1. Colony counter technology
To improve accuracy and repeatability for colony enumeration, recent advances in pharmaceutical microbiology have seen the introduction of technologies designed to automate the enumeration of colonies on the surface of media plates or other support matrices. The illumination and detection systems used in these technologies vary from full spectrum white light bulbs through narrower wavelength Light Emitting Diodes (LEDs) to very narrow wavelength lasers. Data capture is usually performed by a Photo Multiplier Tube (PMT) or a Charge-coupled Device (CCD) with some form of wavelength selecting filter(s) through a lens, that may magnify the image. The technology used will in each case detect microbes as either single cells, microcolonies or full colonies and by using software algorithms, separate true microbial counts from non-microbial objects that could cause false positives. The accuracy of the technology depends on the ability of the software to interpret the images of a wide range of microbial colony shapes, colours, and sizes with a range of background materials that may confuse the detection algorithms. The growth characteristics of organisms can also create problems due to cells clumping, merging, or swarming rapidly over the plate. Given the importance of accurate enumeration of any microbial contaminant in a pharmaceutical product, it is critical that the accuracy of the enumeration be determined during the validation process.
The Growth Direct® technology for the detection of microbial microcolonies uses a black mixed ester cellulose membrane to support growth and reduce background fluorescence during colonial growth on traditional microbiology media substrates.

Figure 1: Scanning Electron Microscope (SEM) images of growing microcolonies used to define minimum colony size for detection on the colony counter. In the C. albicans time-course the system was able to detect the micro-colony at around 2 to 2.5 hours of incubation at 30 to 35°C. E. coli and B. diminuta took 3 and 7 hours respectively to be detected.
The detection of events on the membrane surface is a combination of physical size and fluorescent intensity. The fluorescent intensity is primarily driven by the cell volume (that contains the flavin fluorophore). Robust yeast cells with large volumes can be detected in smaller colonies, ~10 cells, than the slim rod bacteria, ~100 cells.
The Growth Direct® System uses the natural autofluorescence of microorganisms to facilitate their detection on the membrane surface. The details of the technology are described by London et al1. In summary, light from a bank of blue LEDs, wavelength 460 to 495 nanometers (nm), is focused by a lens to evenly illuminate the complete surface of the test membrane ~23,8 cm2. Any material on the surface of the membrane that is excited by the wavelength chosen will fluoresce at its associated emission wavelength. To minimize any non-specific fluorescence that the Charge-coupled Device (CCD) camera could detect, the emitted light passes through a wavelength filter to collect the specific wavelength band emitted by all microorganisms. The collected wavelength range is 510 to 560 nm and is related to the natural flavins present in all viable cells. The light is focused onto the CCD sensor that is tuned to the wavelength of interest.

Figure 2: Growth Direct® System technology: Blue light illuminates the plate surface containing microorganisms. Natural flavins present in all viable cells emit green light which is captured onto a CCD chip – an array of independent photosensitive pixel elements.

Figure 3: Growth Direct® System plates: TSA plates (also called TSA cassettes) are manufactured with a 0.45µm black membrane pre-attached onto the agar surface to prevent background fluorescence from the agar itself. Formulation and sampling surface do match with common TSA Replicate Organism Detection and Counting (RODAC) plates. As plates are processed from above (illumination and fluorescence detection), the plates do have a sure fit vision lid attached to protect sampling surface and enable wavelength passing through the lid unhindered.
The membrane surface is imaged at predetermined time intervals and the x-y coordinates of each detected fluorescent event on the membrane surface, which may be the precursor to the development of a micro colony, are recorded. At each time point the fluorescent intensity of the detected event on each pixel is recorded as well as the number of pixels making up the object size.
Over the course of the sample incubation the system performs the imaging cycle on all the samples on the system, up to 660 plates in total. At each cycle each sample image history is processed to determine if a fluorescent event detected at a particular location is changing its size and/or the intensity of the fluorescence detected by the CCD chip. Fluorescent events become recorded as an object in the database. Size and fluorescent intensity data are added with respect to object and position. Each individual colony is tracked over time and should two or more adjacent colonies merge the system will still remember the constituent counts. This is important for the accurate enumeration of spreading colonies such as the moulds and members of the Bacillus spp. It is interesting to note, that certain organisms spread rapidly on normal media e.g., Paenibacillus glucanolyticus, while forming discrete colonies when grown on the membrane surface of the Growth Direct® media.
The ability of the system to track the development of an event over time allows for the reduction in the number of false positives that the system may see from spurious fluorescent events on the membrane surface or electronic noise. Any fluorescent event that is detected by the system that does not increase either its fluorescent brightness or its physical size with time is regarded as a non-viable particle and not reported. The occurrence of interfering material from products is further reduced as the wavelength selections was optimized to reduce interference from other materials or non-viable particles present on the membrane surface.
1.2. Blue light sensitivity
Visible light has wavelengths between 400 and 700 nm. Within this range, blue light has shorter wavelengths of about 450 to 495 nm. The Growth Direct® System uses the natural fluorescence of microorganisms when illuminated with blue light in the range of 460 to 490 nm to detect and enumerate the development of microcolonies. Reports in the literature have described the use of blue light as a method to sanitize surfaces. Hessling et al have written a good summary of this phenomenon.
The following Figure 4, from Hessling et al. demonstrates the summary of the current literature data in this area. The figure has been modified with Growth Direct® wavelength and power level output.

Figure 4: Effect of wavelength on the lethality for Gram positive and negative cells. The blue area shows where the Growth Direct® power output lies. Data from Hessling et al. modified with Growth Direct® power level and Growth Direct® wavelength used for excitation.
As can be seen, there is a wide range of sensitivity by organism type and wavelength used for irradiation. In general, the higher the wavelength the lower the lethality of the effect. The wavelength used by the Growth Direct® is in the range 460 to 490 nm which is on the lower end of lethality for blue light. From the summary chart above, the lowest dose to show an effect would need to be around 10 to 20 joules/cm2 at the illumination wavelength, while the Growth Direct® System has a dose of 2.57 joules/cm2.
1.3 Materials and methods
To further examine the effects of the Growth Direct® System blue light on microbial recovery, an organism panel of 11 blue light sensitive strains was selected from the European Pharmacopeia, the Hessling paper, and from Halstead et al see Table 1.
Table 1: Blue light sensitive test microorganisms selected from the reference papers for study.

Four series of the test organisms were prepared using Tryptic Soy Agar (TSA) media plates. Each series was prepared by separate analysts. Three of the series used filtration and one was used as a direct spread to the black membrane. The two preparation methods were used in case any stress was induced by the filtration method that made the organisms more sensitive to the blue light. The organisms were prepared at two different density levels to verify if colony density had any effect. At the high density, target Colony Forming Unit (CFU) was chosen to be preferably within 20 to 100 CFU, depending on the microorganism used and its growth behavior. At low densities, target CFU value was < 20 CFU.
Two of the series were incubated in the system and exposed to blue light (Blue light series 1 and 2). The other two series were exposed to a traditional incubator (no blue light) for growth. The Dark spread plate was used as a reference value for the first experiment set (Dark spread plate). The system blue light exposure was increased by 50% over routine use (3.86 joules/cm2) to ensure a “worst case” margin was included.
A secondary experiment used an additional vendor medium, Becton Dickinson TSA, incubated at the same time in a traditional incubator without exposure to blue light to verify no adverse media supplier effect. These plates were used as reference values within the secondary experiment set. Incubation was at 30 to 35°C for 48 to 72 hours for all test series.
The test protocol was designed to focus on two topics:
Effect of blue light on organism growth
Effect of a different media supplier
To minimize variability, test components were kept constant as described in Table 2:
Table 2: Overview of test components, including test series, material and incubation method used

Details on the used equipment and material can be found in the section below:
Growth Direct® Unit #: E310152173
Growth Direct® Funnel lot #: 54663
Growth Direct® vision lid lot #: 42346201 & 40980243A
Growth Direct® TSA cassette lot #: 17717L1
BD media lot # 7264859
Fluid A rinse buffer lot # K-02-1
Six replicates of each test were prepared. Two separate series of plates were prepared for the Blue light series (Growth Direct® series) to ensure good reproducibility.
The colonies on each test cassette/Petri plate were enumerated by three independent analysts to remove any enumeration variability. The tests were prepared by two separate analysts to ensure no user bias.
Any effect of the blue light exposure would be shown by reduced CFU count and recovery in test samples incubated on the Growth Direct® System, compared to incubation in the dark without exposure to blue light in a traditional incubator at the same temperature.
The acceptance criterion was set to >70% recovery for the Growth Direct® incubated samples, compared to the samples incubated within the traditional incubator at the same temperature. The acceptance criterion was chosen in accordance with the regulatory approaches for European pharmacopeia (EP) and United States pharmacopeia (USP)
2. Results and Discussion
2.1 Results
Results for the high-density samples are shown in Table 3 and 4 and Figure 5 and 6. Results for the low-density samples are shown in Table 5 and 6 and Figure 7 and 8.
Results for the secondary experiment are shown in Table 7 and 8 and Figure 9 and 10 for the high-density samples and Table 9 and 10 and Figure 11 and 12 for the low-density samples, comparing the results from Growth Direct® media exposed to blue light with a different media vendor (Becton Dickinson).
Table 3: Mean CFU counts from six replicates and three different analysts, showing the results for the high-density samples for RMB TSA media exposed to blue light within the Growth Direct® System and results for RMB TSA media incubated within a traditional incubator in the dark


Figure 5: Comparison of bacterial growth with high density samples when exposed to blue light in the Growth Direct® System, compared to dark incubation of Growth Direct® media that have been spread plated or filtered.
Table 4: Mean %-recoveries from six replicates and three different analysts, showing the results for the high-density samples for RMB TSA media exposed to blue light within the Growth Direct® System and results for RMB TSA media incubated within a traditional incubator in the dark. Dark spread plate was the reference value and set to 100%.


Figure 6: %-recovery of high density samples when exposed to blue light in the Growth Direct® System, compared to dark incubation of Growth Direct® media that have been filtered. Reference plates (Dark spread plate) are not shown on the graph.
Table 5: Mean CFU counts from six replicates and three different analysts, showing the results for the low-density samples for RMB TSA media exposed to blue light within the Growth Direct® System and results for RMB TSA media incubated within a traditional incubator in the dark.


Figure 7: Comparison of bacterial growth with low density samples when exposed to blue light in the Growth Direct® System, compared to dark incubation of Growth Direct® media that have been spread plated or filtered.
C. albicans recoveries for the first experiment set did not meet the set acceptance criteria of >70%. Blue light series 2 %-recovery was 58.7 % and Dark filtration plate recovery was 47.6 %.
Table 6: Mean %-recoveries from six replicates and three different analysts, showing the results for the low-density samples for RMB TSA media exposed to blue light within the Growth Direct® System and results for RMB TSA media incubated within a traditional incubator in the dark. Dark spread plate was the reference value and set to 100%. Highlighted in yellow are the samples which did not meet acceptance criteria of >70% recovery.


Figure 8: %-recovery of low density samples when exposed to blue light in the Growth Direct® System, compared to dark incubation of Growth Direct® media that have been filtered. Reference plates (Dark spread plate) are not shown on the graph. Blue light series 2 and dark filtration plate for C. albicans are below the set acceptance criteria of >70% recovery.
Table 7: Mean CFU counts from six replicates and three different analysts, showing the results for the high-density samples for RMB TSA media exposed to blue light within the Growth Direct® System and results for Becton Dickinson BD TSA media incubated within a traditional incubator in the dark.


Figure 9: Comparison of bacterial growth with high density samples when exposed to blue light in the Growth Direct® System, compared to dark incubation BD media.
Table 8: Mean %-recoveries from six replicates and three different analysts, showing the results for the high-density samples for RMB TSA media exposed to blue light within the Growth Direct® System and results for Becton Dickinson BD TSA media incubated within a traditional incubator in the dark. Becton Dickinson was the reference value and set to 100%.


Figure 10: %-recovery of high density samples when exposed to blue light in the Growth Direct® System, compared to dark incubation BD media. Reference plates (BD) are not shown on the graph.
Table 9: Mean CFU counts from six replicates and three different analysts, showing the results for the low-density samples for RMB TSA media exposed to blue light within the Growth Direct® System and results for Becton Dickinson BD TSA media incubated within a traditional incubator in the dark.


Figure 11: Comparison of bacterial growth with low density samples when exposed to blue light in the Growth Direct® System, compared to dark incubation BD media.
Table 10: Mean %-recoveries from six replicates and three different analysts, showing the results for the low-density samples for RMB TSA media exposed to blue light within the Growth Direct® System and results for Becton Dickinson BD TSA media incubated within a traditional incubator in the dark. Becton Dickinson was the reference value and set to 100%.

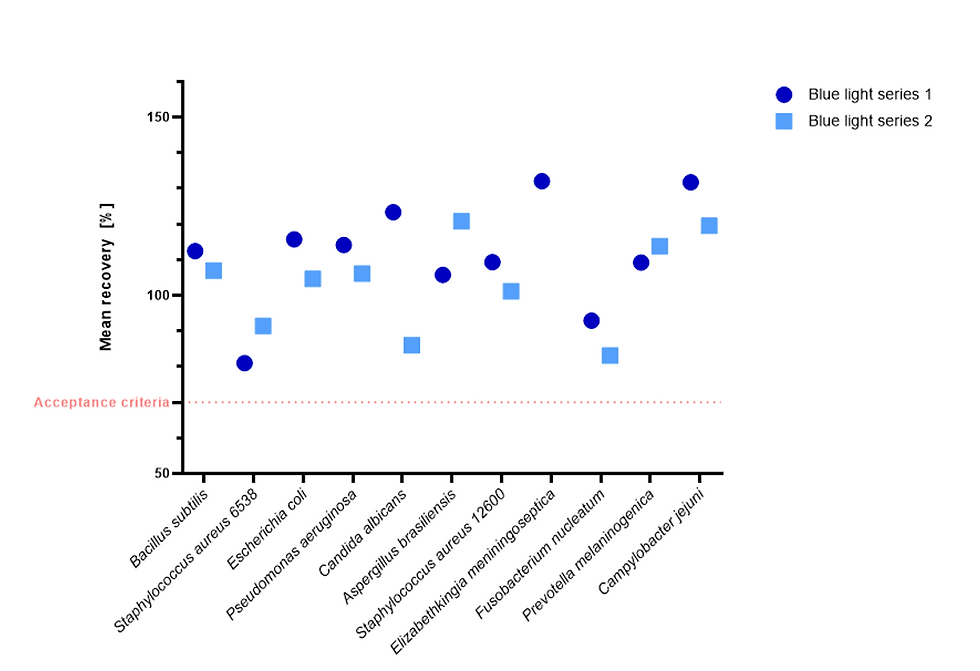
Figure 12: %-recovery of low density samples when exposed to blue light in the Growth Direct® System, compared to dark incubation BD media. Reference plates (BD) are not shown on the graph.
All recoveries for all experiments passed the acceptance criterion of >70% recovery when compared to the dark spread plate reference values or the Becton Dickinson media values with the exception of low-density samples for C. albicans Blue light series 2 (58.7 %-recovery) and Dark filtration plate (47.6 %-recovery).
There was no apparent effect of the blue light on recovery of organisms when compared to the spread plate control or the filtration plate method incubated in a traditional incubator, as well as compared to the other vendor’s medium.
No significant growth differences between the Growth Direct® test samples (which have been exposed to blue light) and traditionally incubated samples without exposure to blue light have been observed.
Regarding absolute count comparisons, only negative comparison values have been investigated due to the aim of the study. Absolute CFU counts from Growth Direct® samples which have been exposed to blue light differ by -3.9 CFUs for the high-density samples at most, compared to the traditional incubated spread plate samples in the dark. For the low-density samples, the highest absolute CFU count difference was -5.7 CFUs.
When comparing the additional media supplier Becton Dickinson, incubated in the dark, with the Growth Direct® media exposed to blue light, absolute CFU differences are -5.7 CFUs for high-density samples and -2.6 CFUs for low-density samples at the most.
No significant difference between the tested high- and low-density levels could be observed.
2.2 Discussion
In this validation, we have shown that blue light excitation from the Growth Direct® System at 460 to 490 nm does not inactivate nor damage different viable micro colonies. This is also supported by available other publications [2, 3].
Comparing the results from the Growth Direct® test series exposed to blue light to the dark Growth Direct® or BD media, no significant difference could be observed. All test series grew within a recovery rate of > 73.7%, with the exception of the low-density samples for C. albicans Blue light series 2 (58.7 %-recovery) and Dark filtration plate (47.6 %-recovery). These two samples did not meet the set acceptance criteria of >70 %-recovery. The low recovery could be explained by low inoculation numbers for the first experiment series. As these samples should have a low-density CFU, target values were chosen to be < 20 CFU. Final CFU count for all the samples of C. albicans low-density samples are < 6.3 CFU, where 6.3 is also the reference value for the dark spread plate. Within the small numbers of CFUs, minor differences do impact the recovery value significantly. We can exclude a negative effect of blue light excitation for this sample as the control value for the Dark filtration plate also shows low CFU count and therefore a related low recovery rate of 47.6%. Additionally, the Blue light series 1 does show a sufficient recovery of 84.1 % for C. albicans. Because of these facts, the low recovery value is most likely a low inoculation and biological effect, rather than a negative effect on the growth of the blue light excitation. If it would be a negative effect of the blue light excitation, we would see also a significant reduction of CFU counts and recovery for other samples with microorganism C. albicans, which did not occur over the whole validation.
Other different recovery rates are most likely related to microbial growth behavior and preparations and not related to the testing objective, as they could be found to be single events and not being systematic or methodical.
Absolute CFU counts differed only by up to -5.7 CFUs for all tested series and samples. If compared to other tested samples for the same microorganism (e.g., E. coli within the low-density samples) a homogenous CFU count bias to the reference value of the Dark spread plate could be observed. As also the filtered RMB TSA medium, which was incubated in the dark, had a bias of -4.7 CFUs, the bias can be linked most likely either to methodology or to biological differences. The same is applicable for the respective recovery rates.
It was shown by Hessling et al, that sufficient illumination power would be necessary to cause a log reduction. The higher the wavelength and the lower the illumination power, the less likely are microorganisms to be lethally damaged. Hessling et al showed, that a wavelength of below 450 nm and a power of above 10 joules/cm2 would be a starting point at which cells would be taking irreversible damage. Regarding power levels and wavelength, the exposure duration is also an important factor. Hessling et al also refer to the possibility of cell damage with wavelength above 450 nm. But this would need an increase in power level.
The Growth Direct® blue light excitation within this study had a 50% higher power level than the standard excitation (3.86 joules/cm2) representing a worst-case scenario and had an excitation wavelength between 460 to 490 nm, thus falling outside the potentially damaging settings described by Hessling et al and Halstead et al. Additionally, the illumination duration is <1 sec. per imaging process (3 images per imaging process each 4 hours) and therefore far less than >15 minutes described by Halstead et al.
Halstead et al showed that blue light at 400 nm wavelength and a power level of 54 joules/cm2 with an exposure time of >15 min. would be sufficient for most of the tested organisms to be reduced by 5-ln. If we also compare the evaluated settings by Halstead et al, the parameter used by Growth Direct® excitations are significantly lower, thus leading to the conclusion that the Growth Direct® parameter does not pose a threat to viable micro-organisms due to the lack of power level, the short time-period of exposure of less than 5 sec. and the higher wavelength used (460 to 490 nm). With the tested blue light sensitive microorganisms (Table 1) as a worst-case scenario, it could also be concluded that the Growth Direct® blue light excitation poses little or no risk of damaging or killing other microorganisms not tested in this study.
Thus, we have demonstrated that usage of the blue light imaging technology for the detection of viable microcolonies with the Growth Direct® System is feasible and poses no observable risk to viable microcolonies, either at high-densities or at low-densities.
3. Conclusion
Within our study, we have demonstrated that the blue light illumination by the Growth Direct® System shows no observable effect on the viable microcolonies examined in this study on the RMB TSA medium plate. This conclusion could also be transferred to other RMB media and applications, as well as for other microorganisms that haven’t been part of this study, due to the relatively small power level, wavelength used, and excitation time utilized by the Growth Direct® System. However, to assure this transfer, additional studies might be required including the different media (such as R2A and SDA)
Nevertheless, a high data variability was observed when comparing the results with known literatures and summaries [2, 3]. There might be additional contributing factors, such as oxygen concentration as mentioned by Hessling et al., as well as additional photosensitive microorganisms that weren’t challenged within the studies which might be affected by blue light excitation.
However, it was shown that the Growth Direct® System can be safely used for the intended use of automated microbial enumeration.
4. Acknowledgement
We thank Hessling et al., as well as Halstead et al., and all associated colleagues for their work on the summary for the blue light antibacterial activity.
5. Conflict of Interest
The authors hereby do declare no conflict of interest nor financial interest.
References
01. London, R., J. Schwedock, A. Sage, H. Valley, J. Meadows, M. Waddington and D. Straus. (2010) “An automated system for rapid non-destructive enumeration of growing microbes.” PLos ONE 5(1) (2010): e8609.
02. M. Hessling, B. Spellerberg and K. Hoenes. (2017) “Photoinactivation of bacteria by endogenous photosensitizers and exposure to visible light of different wavelengths – a review on existing data.” FEMS Microbiology Letters, 364: (2017): fnw270.
03. Fenella D. Halstead, Joanne E. Thwaite, Rebecca Burt, Thomas R Laws, Marina Raguse, Ralf Moeller, Mark A Webber and Beryl A. Oppenheim. (2016) “The antibacterial activity of blue light against nosocomial wound pathogens growing planktonically and as mature biofilms." PUBLIC AND ENVIRONMENTAL HEALTH MICROBIOLOGY, Vol 82, Issue 13 (2016): 4006-4016.
Authors
Corresponding Author: Johannes Oberdoerfer, Field Application Scientist, Rapid Micro Biosystems
Email: joberdorfer@rapidmicrobio.com
Tele: +49 (978) 349-3200
Authors: Johannes Oberdoerfer, Jamie Brosseau and David L. Jones - Rapid Micro Biosystems


Comments