- lauraclark849
- Oct 8, 2025
- 22 min read
Updated: Jun 15
Retracted - Peer Review Article | Open Access | Published 8th October 2025
The article titled “Prescriptive Maintenance Strategy for Cost Optimization in CG Membrane Systems within Pharmaceutical Isolators” by Sai Vijay Thattukolla, published in European Journal of Parenteral & Pharmaceutical Sciences (EJPPS), Volume 30 Issue 3 (2025), has been retracted at the request of the author.
Following publication, the author identified significant errors in the content that affect the accuracy and reliability of the findings presented. In order to prevent the dissemination of potentially misleading or incorrect information and to uphold the integrity of the scientific record, the author formally requested the retraction of the article.
The editorial team has reviewed the request and agreed that retraction is the most appropriate course of action. The article is therefore withdrawn from the journal’s active record.
EJPPS remains committed to maintaining high standards of academic integrity and transparency in scholarly publishing.
SaiVijay Thattukolla | EJPPS | 303 (2025) |https://doi.org/10.37521/ejpps30306
Abstract
Maintaining sterility in pharmaceutical isolators hinges on the performance of CG (Ciba Geigy) membranes, which regulate unidirectional laminar airflow across Grade A environments. Traditionally, manufacturers have relied on reactive or time-based membrane replacement strategies—often resulting in high costs, long lead times, and extended equipment downtime. This study presents a prescriptive maintenance approach designed to optimize the lifecycle of CG membranes through targeted refurbishment, grounded in measurable performance data and risk-based decision-making.
A multi-parameter monitoring framework was implemented to track membrane health across 11 CG units within a commercial-grade vial filling isolator. Key indicators included surface tension measurements (target range: 5–7 N/cm), airflow velocity deviations (±15% from baseline), visual wear such as warping or seal degradation, abnormal pressure decay behavior, and the cumulative number of sterilization cycles exceeding 50. A simple traffic-light matrix—Green (Normal), Yellow (Monitor), and Red (Refurbish)—was developed to support proactive maintenance scheduling.
Over two years, 44 individual membrane refurbishments were completed across four maintenance cycles. Each refurbishment was triggered by at least one failing parameter and followed by full requalification using surface tension testing, airflow probes, and pressure hold validation. Compared to OEM replacement, which averaged $110,000 per cycle with a 10–12 week lead time, the refurbishment protocol reduced total costs to $50,000—yielding a 55% savings—while cutting downtime by over 60%.
The results demonstrate that a data-driven, prescriptive maintenance strategy can effectively extend component life without compromising GMP compliance. This approach not only supports operational efficiency and cost control but also aligns with broader industry goals of sustainability and supply chain resilience. The framework is scalable and may be adapted to other isolator components and sterile barrier systems.
Key words: CG Membranes, Prescriptive Maintenance, Pharmaceutical Isolators, Aseptic Processing, Refurbishment strategy, GMP compliance, Cost and Downtime reduction
1.INTRODUCTION
In aseptic pharmaceutical manufacturing, maintaining a sterile environment is critical to ensuring product quality and regulatory compliance. Isolator systems have become the preferred platform for high-containment aseptic operations, offering superior sterility assurance compared to traditional cleanrooms and Restricted Access Barrier Systems (RABS). A key internal component within these isolators is the CG (Ciba Geigy) membrane—an airflow distributor panel positioned within the ceiling plenum that plays a central role in sustaining ISO Class 5 (Grade A) laminar airflow.
These membranes are constructed from PETP (polyethylene terephthalate) mesh, chosen for its low particulate shedding, high chemical resistance, and compatibility with vaporized hydrogen peroxide (VHP) and isopropyl alcohol (IPA) sterilants. Their structural integrity and surface properties directly influence the isolator’s ability to maintain unidirectional airflow and minimize turbulence, thereby ensuring the aseptic core remains free of airborne contamination.
Despite their critical function, CG membranes are susceptible to gradual performance degradation due to repeated exposure to sterilants, mechanical stress, and particulate accumulation. The traditional approach to managing this degradation is full OEM replacement—often performed as part of scheduled preventive maintenance. However, this strategy presents significant limitations, including excessive costs (e.g., $110,000 per replacement cycle for 11 membranes), extended lead times (typically 10–12 weeks), and increased risk of production downtime. Furthermore, the industry’s reliance on single-source OEM suppliers introduces vulnerabilities in global supply chain resilience.
While other sectors of pharmaceutical and healthcare manufacturing have explored component reuse—such as reconditioned isolator glassware or remanufactured surgical instruments—there is little published guidance or precedent for refurbishing CG membranes. This represents a critical gap in component lifecycle management, especially considering the potential for sustainability improvements and cost control.
The purpose of this study is to present a validated prescriptive maintenance strategy for CG membranes, offering a viable alternative to full replacement. This framework incorporates a multi-parameter decision matrix, including surface tension, airflow velocity, visual inspection, and sterilization cycle count, to proactively identify when membranes should be refurbished. The refurbishment process itself includes disassembly, cleaning, seal reconditioning, tension testing, and full GMP requalification.
Over a two-year period, 44 refurbishment events were conducted on 11 CG membranes within a commercial vial filling isolator. All membranes were successfully requalified, and no deviations or airflow disruptions were observed. The total cost per refurbishment cycle was reduced by 55%, with significant reductions in isolator downtime.
This work addresses a longstanding gap in pharmaceutical isolator maintenance strategy and proposes a scalable, GMP-compliant model for component reuse. By reducing cost, enhancing operational flexibility, and aligning with sustainability goals, prescriptive membrane refurbishment offers a practical innovation in sterile manufacturing.
2.Problem Statement
Pharmaceutical isolators are critical to maintaining sterility in aseptic drug manufacturing, and their internal airflow components—specifically CG (Ciba Geigy) membranes—play a key role in sustaining unidirectional laminar flow across ISO Class 5 (Grade A) zones. However, current industry practice relies heavily on full membrane replacement as a default maintenance strategy, without incorporating data-driven methods to assess membrane condition or predict performance degradation.
This reactive or time-based approach presents multiple challenges. First, the financial burden of OEM replacements is substantial, with costs exceeding $110,000 per cycle for a single isolator containing 11 membranes. In addition, OEM lead times often span 10–12 weeks, creating significant scheduling challenges, particularly for high-throughput operations. During these delays, isolators may remain offline or operate at suboptimal performance, increasing the risk of deviation from GMP standards.
Second, current maintenance protocols lack prescriptive or predictive capabilities. Membranes are frequently replaced based on fixed schedules or post-failure detection, rather than being informed by real-time performance indicators. This absence of condition-based decision-making leads to premature replacements, increased costs, and missed opportunities to extend component life cycles.
Third, isolator downtime triggered by unplanned membrane failures or delayed replacements can compromise batch production, strain operational resources, and jeopardize compliance. In tightly regulated environments, even short periods of airflow inconsistency or pressure loss can result in sterility breaches, product recalls, or regulatory citations.
Finally, the industry remains heavily dependent on single-source OEM suppliers, limiting flexibility and exposing manufacturers to global supply chain disruptions. The environmental impact of unnecessary membrane disposal, coupled with the lack of a validated reuse pathway, further underscores the need for a more sustainable and resilient maintenance model.
This study addresses these critical gaps by proposing a prescriptive maintenance framework that leverages multi-parameter performance data to guide membrane refurbishment, reducing both cost and downtime while ensuring GMP compliance. A comparison of these two approaches is summarized in Table 1 below.
Parameter | Traditional OEM Replacement | Prescriptive Refurbishment |
Maintenance Trigger | Time-based or reactive (post-failure) | Condition-based (multi-metric performance data) |
Cost per Cycle (11 membranes) | ~$110,000 USD | ~$50,000 USD |
Lead Time | Lead Time 10–12 weeks | 3–4 weeks |
Downtime Impact | High (unscheduled or prolonged outages) | Low (scheduled during planned maintenance) |
Lifecycle Strategy | No reuse; full component replacement | Validated reuse via refurbishment |
Environmental Impact | High (membrane disposal after sole use) | Lower (extended membrane life) |
Regulatory Risk | Risk of non-compliance due to replacement delay | Reduced risk through proactive maintenance |
Supply Chain Dependency | High (single-source OEM reliance) | Reduced (local/vendor-supported refurbishment) |
Table 1: Traditional OEM vs prescriptive refurbishment
3.Literature Review
Ensuring the integrity of Grade A environments in pharmaceutical isolators is fundamental to aseptic manufacturing. Regulatory bodies such as the U.S. FDA¹, the European Medicines Agency (EMA)², and global frameworks like ISO 14644-5³ establish rigorous airflow, particulate, and pressure control standards. Pharmaceutical isolators are designed to meet these standards through the use of HEPA-filtered unidirectional airflow systems, providing physical separation from external contamination sources⁴,⁵. Within these systems, airflow distributor membranes—specifically CG (Ciba Geigy) membranes—play a vital role in maintaining uniform laminar flow across the critical zone⁶.
Multiple studies have examined airflow visualization⁷, air velocity profiling⁸, and pressure decay validation⁹,¹⁰ in isolators. Smoke studies and decontamination cycle development have also been emphasized by agencies like PIC/S and ISPE¹¹,¹². These techniques are essential for maintaining aseptic conditions and are widely implemented during both initial qualification and ongoing validation.
However, while environmental control parameters are well understood, component lifecycle management remains underexplored. Most industry practice relies on scheduled OEM replacements for membrane components without a formal decision framework for refurbishment or reuse¹³,¹⁴. This results in increased operational costs, supply chain vulnerability, and avoidable environmental waste. The industry’s emphasis on sterility often leads to conservative approaches—opting for full replacement even when component performance could be restored through validated refurbishment¹⁵.
In contrast, the healthcare and engineering sectors have successfully adopted remanufacturing and reuse strategies. For example, reprocessed surgical instruments have shown safety and performance equivalence when subjected to validated decontamination and requalification protocols¹⁶,¹⁷. Within pharmaceutical operations, component reuse has been documented for isolator glassware, glove ports, and filter housings—demonstrating up to 60% reductions in CO₂ emissions and significant cost savings¹⁸,¹⁹.
Recent literature on predictive and prescriptive maintenance further highlights the shift toward data-informed lifecycle management. AI-driven maintenance frameworks now utilize sensor data (pressure, vibration, airflow), historical failure trends, and machine learning models to predict equipment degradation in real-time²⁰,²¹. Studies have shown that integrating sensor fusion and predictive analytics can extend equipment life and reduce unexpected failures by over 40%²²,²³. While much of this research has focused on large mechanical assets (e.g., compressors, pumps), the application of these models to cleanroom infrastructure—including isolator membranes—is emerging²⁴.
Digital twins, in particular, are being explored as virtual models to simulate airflow behavior and membrane performance deterioration under repeated sterilization cycles²⁵. This approach, combined with reinforcement learning, has been shown to optimize maintenance intervals in highly regulated environments²⁶,²⁷. Pharmaceutical equipment manufacturers are beginning to incorporate predictive tools into isolator systems, but adoption remains in preliminary stages²⁸.
Despite this progress, peer-reviewed literature documenting implemented prescriptive maintenance for CG membranes is nonexistent. This represents a critical gap—especially given the excessive cost (~$110,000 per cycle), long lead times (10–12 weeks), and regulatory downtime risks associated with OEM replacements²⁹. A recent cost–benefit model by Psarommatis and May³⁰ demonstrated the financial and environmental impact of circular refurbishment in GMP environments, but their framework has yet to be applied specifically to membrane systems.
This study builds on these insights by presenting a real-world implementation of a prescriptive maintenance strategy for CG membranes in a commercial vial filling isolator. By integrating performance metrics—such as surface tension, airflow velocity deviation, sterilization cycle counts, and pressure integrity—the approach shifts decision-making from reactive to predictive. In doing so, it not only aligns with GMP expectations but also introduces a scalable, risk-based methodology that can be expanded to other isolator components and cleanroom environments.
4. Methodology
4.1 Equipment and Isolator Configuration
This study was conducted within a commercial aseptic manufacturing suite using a high-throughput vial filling isolator equipped with 11 CG (Ciba Geigy) membranes. The isolator, sourced from OPTIMA Packaging Group GmbH, operates under ISO Class 5 (Grade A) conditions in accordance with EudraLex Annex 1 and ISO 14644-5 standards. Each membrane panel, located in the ceiling plenum, is constructed using SEFARE PETEX 07-44/25 PETP monofilament mesh, chosen for its chemical durability, dimensional stability, and compatibility with vaporized hydrogen peroxide (VHP) decontamination cycles.

4.2 Refurbishment Workflow
A total of 44 CG membrane refurbishments were completed over four maintenance cycles spanning two years. The refurbishment followed a standardized, GMP-compliant 7-step protocol designed to restore membrane performance while reducing cost and lead time.


4.2 Refurbishment Procedure (7-Step Protocol)
Each CG (Ciba Geigy) membrane underwent a validated, structured seven-step refurbishment process, carried out in a cleanroom-adjacent service area by trained GMP personnel. The objective was to restore membrane functionality and airflow performance while maintaining full compliance with aseptic manufacturing standards. All actions were documented in accordance with site SOPs, and traceability was maintained through refurbishment records and membrane serial numbers.
Step 1: Membrane Removal
The vial filling isolator was first powered down and secured following lockout/tagout (LOTO) protocols.
Each of the 11 membrane panels was carefully detached from the ceiling plenum using non-abrasive tools to prevent tearing or misalignment.
Removed units were immediately transferred in pre-cleaned stainless-steel carts to a controlled cleanroom-adjacent maintenance area.
Personnel wore ISO Class 7-compatible gowning, and transfer surfaces were sanitized with sterile 70% isopropyl alcohol (IPA).
Step 2: Initial Visual Inspection
Under bright-field inspection lighting, each membrane was examined for:
Mesh distortion, discoloration, or sagging.
Edge seal detachment or cracking
Particle or bioburden accumulation
Mechanical damage such as punctures or delamination
Units with critical damage were flagged for rejection or partial frame rebuild. Minor deformities were logged for corrective work.
Step 3: Disassembly and Cleaning
Degraded PETP mesh and adhesive residues were removed using non-shedding tools and sterile swabs.
Frame and surface areas were cleaned using lint-free sterile wipes soaked in 70% IPA within a low-particle controlled zone.
Special attention was paid to corners and seal recesses where residue buildup is common.
Cleaned units were air-dried using filtered laminar airflow, and final wipe-downs were performed prior to resealing.
Step 4: Seal Reconditioning and PETP Mesh Replacement
Loose or degraded perimeter seals were:
Removed and replaced with cleanroom-compatible adhesive.
Re-aligned using precision edge guides to maintain uniform compression.
A fresh sheet of SEFARE PETEX 07-44/25 PETP monofilament mesh was cut to size and affixed to the frame.
The sheet was tensioned evenly and adhered with minimal over-application of bonding agent to avoid adhesive overflow.
Edges were trimmed and heat-sealed if necessary to ensure structural integrity and to eliminate airflow turbulence.
Final flatness and uniformity were confirmed by visual inspection and frame integrity checks.
Step 5: Surface Tension Validation
Each refurbished membrane was tested using a Tefas-check 100 surface tension meter, the same model used by the OEM for qualification.
The target hydrophobicity range was defined as 5–7 N/cm, with out-of-spec units flagged for rework.
Results were logged electronically and cross-checked against historical OEM certificates for benchmarking.
Step 6: Leak Integrity and Pressure Hold Testing
Refurbished membranes were mounted onto a bench test rig simulating isolator back-pressure condition.
A 60-second pressure decay test was performed at 1 bar using the site’s GMP-validated test system.
Acceptance criteria: No drop in pressure below 1 bar within the 60-second window.
Membranes failing this test were disassembled and re-sealed for retesting.
Passed units were labeled and marked as “ready for installation.”
Step 7: Reinstallation and Final Qualification
Refurbished membranes were returned to the isolator and installed using alignment jigs to ensure frame-to-frame consistency.
Installation was verified by visual inspection and seal seating confirmation.
With the system powered back on, the following tests were performed:
Airflow Velocity Mapping: Five-point probe measurements beneath each membrane to confirm laminar flow integrity.
Smoke Pattern Testing: Optional visualization to confirm directional airflow and absence of turbulence.
System-Level Pressure Decay: Final leak integrity test using isolator’s built-in monitoring system.
No deviation alarms were triggered, and all 11 membranes passed requalification. Full documentation—including surface tension logs, pressure test reports, and visual acceptance forms—was retained in accordance with audit requirements.
4.3 Data Collection and Monitoring Strategy
To support prescriptive maintenance, a multi-metric monitoring model was implemented, combining both quantitative measurements and historical performance indicators. Each membrane was evaluated using the following criteria:
Surface Tension Testing and Validation
Surface energy performance of the CG membranes was evaluated through direct surface tension measurement using a Tefas-check 100 precision tensiometer, which applies drop formation analysis to determine liquid-solid interfacial tension. Membranes were evaluated post-cleaning and pre-operation using a standardized aqueous test fluid. Measurements were taken at five representative points across each membrane (four corners and center), and the average was recorded. A validated threshold of 5 N/cm was set as the minimum acceptable surface tension value, based on baseline readings from new membranes and validated supplier specifications. Membranes with surface tension below this limit were flagged for hydrophobic degradation, a key indicator of VHP overexposure or chemical breakdown.
All testing procedures adhered to a GMP-validated internal SOP, and instruments were calibrated biannually using traceable certified standards. Readings were manually recorded in controlled logbooks and digitized into the asset tracking module of the site’s CMMS for traceability and audit readiness. Any membrane falling below the 5 N/cm threshold was automatically categorized as “Yellow” under the prescriptive maintenance matrix, requiring intensified monitoring and re-evaluation within 7 days. If additional degradation occurred or other parameters (e.g., airflow or sterilization cycles) were also out of range, the membrane was escalated to “Red” status for immediate refurbishment. This surface tension testing served as a predictive indicator of performance decline, particularly in detecting early chemical wear not visible on physical inspection.
Airflow Velocity Measurement and Validation:
To monitor membrane performance and enable data-driven refurbishment decisions, airflow velocity was measured across all 11 CG membranes using a calibrated hot-wire anemometer (TSI VelociCalc 9565 with Straight Probe 964). Measurements were taken approximately 10 cm beneath the membrane surface inside the isolator enclosure, with the probe oriented perpendicularly to maintain laminar alignment. Each membrane was assessed at three evenly spaced points, and the mean airflow velocity was calculated. A baseline reference of 0.40 m/s was established from OEM data for new membranes. Deviations exceeding ±15% of baseline (i.e., outside the 0.37–0.43 m/s range) were flagged as early indicators of performance degradation.
The measurement procedure was governed by a validated procedure, aligned with ISO 14644-3 standards for cleanroom airflow testing, and approved under GMP quality systems. All readings were logged in maintenance records and cross-verified in the site’s CMMS platform (e.g., Maximo or SAP PM). Device calibration was traceable to NIST standards and verified annually by an ISO 17025-accredited laboratory. To ensure accuracy and repeatability, 5% of the membranes were retested by a second qualified technician, with a relative standard deviation (RSD) of less than 2%. This validated, risk-based measurement approach formed a critical component of the prescriptive maintenance framework, enabling proactive membrane refurbishment before airflow deterioration reached critical thresholds or compromised aseptic conditions.
Surface Tension: Measured before and after using a calibrated tensiometer.
Airflow Velocity: Deviation tracked relative to historical baseline for each membrane position.
Visual Indicators: Manual inspections for seal wear, mesh discoloration, or deformation
Sterilization Cycle Count: Each membrane logged for number of VHP cycles (>50 triggered yellow/red status)
Pressure Decay Patterns: Isolator logs reviewed for anomalies during routine integrity checks.
A maintenance decision matrix (Table 2) categorized membranes as Green, Yellow, or Red, triggering appropriate actions. Maintenance logs were stored in a validated Excel-based tracking system with audit trails and inspection checklists. While no automated AI tools were used in this implementation, the matrix logic is compatible with future integration of sensor-based predictive analytics platforms.
4.4 Performance Metrics and Evaluation Criteria
The refurbishment protocol was evaluated based on:
Metric | Definition |
Cost Reduction | OEM replacement vs. total refurbishment cost per cycle |
Lead Time Improvement | Reduction in wait time from procurement to readiness (in weeks) |
Downtime Avoidance | Downtime Avoidance % reduction in isolator offline time, measured against previous cycles |
Performance Parity | Refurbished membrane passing all requalification tests (airflow, tension, seal) |
Lifecycle Extension | Membranes reused across multiple validated intervals (up to four refurbishment rounds) |
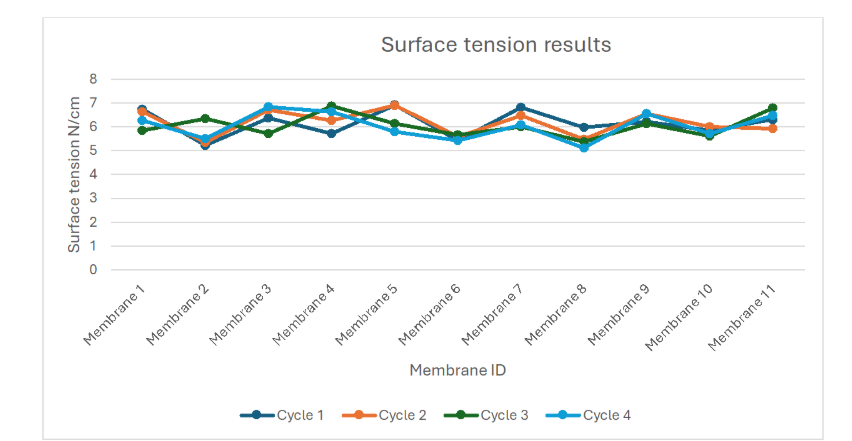
Membrane ID | Cycle 1 | Cycle 2 | Cycle 3 | Cycle 4 |
Membrane 1 | 6.74 | 6.65 | 5.85 | 6.27 |
Membrane 2 | 5.23 | 5.35 | 6.34 | 5.51 |
Membrane 3 | 6.38 | 6.72 | 5.72 | 6.84 |
Membrane 4 | 5.71 | 6.28 | 6.88 | 6.63 |
Membrane 5 | 6.92 | 6.91 | 6.15 | 5.79 |
Membrane 6 | 5.44 | 5.59 | 5.66 | 5.43 |
Membrane 7 | 6.83 | 6.47 | 6.01 | 6.09 |
Membrane 8 | 5.97 | 5.49 | 5.38 | 5.12 |
Membrane 9 | 6.22 | 6.55 | 6.13 | 6.57 |
Membrane 10 | 5.86 | 6.01 | 5.62 | 5.73 |
Membrane 11 | 6.31 | 5.92 | 6.79 | 6.48 |
Table 3: Surface Tension Results Across 44 Refurbishments
The following table summarizes the OEM replacement and refurbishment cost, downtime, and lead time with graphs.
Bar 1: $110K, 12 weeks
Bar 2: $50K, 3–4 weeks
Metric | OEM Replacement | Refurbishment |
Total Cost (USD) | 110,000 | 50,000 |
Lead Time (weeks) | 12 | 4 |
Downtime (hours) | 48 | 16 |
Table 4: OEM replacement Vs Refurbishment
5. Results
This section presents the outcomes of implementing a prescriptive maintenance and refurbishment strategy for 11 CG (Ciba Geigy) membranes over a two-year period. A total of 44 refurbishment events were completed across four scheduled maintenance cycles, each triggered by performance degradation in one or more monitored parameters. All membranes were evaluated before and after refurbishment using surface tension testing, airflow velocity mapping, pressure decay tests, and visual inspection criteria. The results were compared against historical OEM performance baselines and GMP acceptance thresholds.
5.1 Surface Tension Validation
Each membrane underwent surface tension testing using the Tefas-check 100 tensiometer both prior to and after refurbishment. As shown in Figure 5, all forty-four membrane panels demonstrated values within the validated GMP acceptance range of 5.0–7.0 N/cm, consistent with OEM specifications.
While surface tension did not independently trigger any refurbishment, it served as a critical post-refurbishment validation metric, confirming that PETP mesh hydrophobicity and surface integrity were preserved. The average surface tension across all cycles was 6.12 ± 0.42 N/cm, indicating minimal material fatigue over multiple reconditioning events.
5.2 Leak Integrity and Pressure Retention
Each membrane was subjected to a 60-second pressure decay test at 1 bar, using both a bench test rig and the isolator’s integrated leak test system. All 44 refurbished membranes passed without any measurable pressure loss.
The system-level requalification post-installation also recorded no deviation alarms, confirming full seal integrity and containment performance. These results demonstrate that reconditioning of the edge seals did not compromise physical integrity, even after repeated refurbishment.
5.3 Airflow Uniformity and Laminar Flow Integrity
Airflow velocity measurements were taken at five points per membrane using calibrated airflow probes. Measured velocities for refurbished membranes remained within ±10% of historical OEM benchmark values. Optional smoke studies performed during requalification showed consistent, unidirectional laminar airflow across the Grade A working zone.
No turbulence, airflow reversals, or dead zones were observed, confirming that the reinstalled membranes supported cleanroom-grade airflow distribution. These findings validate the effectiveness of PETP tensioning and seal reformation during refurbishment.
5.4 Visual Inspection and Cleanroom Readiness
All membranes underwent visual inspection post-cleaning and reconditioning. Key criteria included:
Mesh flatness and uniformity.
Edge seal continuity
Absence of surface discoloration or particulate buildup
All 44 membranes met internal cleanroom re-entry standards and were cleared for use in aseptic environments. No mechanical stress, warping, or delamination was noted during any of the four maintenance cycles.
Figure 3. OEM vs. Refurbished Membrane Appearance
Refer Section 4.2 7-Step Refurbishment Workflow
5.5 Cost and Downtime Savings
The OEM quoted cost for replacing 11 CG membranes was $110,000 USD per cycle, with lead times ranging from 10 to 12 weeks. The total cost for each refurbishment cycle was reduced to approximately $50,000, including labor, materials, and validation testing.
Over four refurbishment cycles, this strategy achieved a cumulative cost savings of ~$240,000 USD, representing a 55% reduction per cycle. Additionally, refurbishment was completed in 3–4 weeks, cutting equipment downtime by over 60%, as most activities were completed during scheduled maintenance windows.

Refer Table 1. OEM vs. Refurbishment Strategy Comparison

5.6 Justification for Four Refurbishment Cycles
Between 2023 and 2025, a total of four refurbishment cycles were executed. These were not performed reactively in response to membrane failure but were instead triggered proactively through a multi-metric decision matrix and risk-based observations. While all membranes met GMP acceptance criteria for surface tension, airflow uniformity, and pressure decay, several emerging issues and preventive strategies justified the interventions:
Cycle 1: VHP Pooling Observed
Observation: During weekly visual inspections, three membranes showed signs of vaporized hydrogen peroxide (VHP) pooling along the lower mesh region.
Risk: Pooling suggests potential loss of hydrophobicity or uneven membrane tension, which can compromise sterilant distribution and condensate drainage.
Action: Full set of 11 membranes refurbished to restore uniform hydrophobic surface performance and eliminate any risk of localized microbial harboring.
Rationale: Though surface tension remained above 5 N/cm, pooling was considered an early warning sign. Risk to sterility assurance justified preemptive action.
Cycle 2: Exceeded Sterilization Cycle Limit
Observation: 8 of 11 membranes had exceeded 50 VHP sterilization cycles, the upper limit defined in internal qualification protocols.
Risk: Prolonged exposure to oxidizing sterilants degrades polymer integrity and weakens edge seals, even if physical damage is not yet visible.
Action: Full refurbishment of all 11 membranes.
Rationale: While performance remained within spec, historical data showed increasing airflow variation and seal fatigue beyond this point.
Cycle 3: Airflow Deviation in 3+ Membranes
Observation: Routine airflow velocity measurements showed 3 membranes with >15% deviation from baseline values, violating the “Green” status.
Risk: Inconsistent airflow undermines unidirectional laminar flow and raises the risk of contamination in Grade A aseptic zones.
Action: Preemptive refurbishment triggered per the “Red” classification in the maintenance decision matrix.
Rationale: Escalation to full panel refurbishment ensured uniform revalidation and operational harmony.
Cycle 4: Strategic Stock Reconditioning
Observation: No immediate failure indicators, but:
Two membranes showed mild edge seal separation during removal.
All units approaching next preventive maintenance window.
Action: All 11 membranes refurbished, but only two installed, and nine retained as validated spares.
Rationale: Ensured rapid replacement readiness and eliminated downtime risk during future isolator failures or scheduled changeouts.
Summary
In all four cycles, the trigger was prescriptive, not reactive. The approach was driven by early, risk-informed indicators such as VHP pooling, sterilization fatigue, and airflow deviations—not by catastrophic failure. Two of the four refurbishment cycles were strategically used to build validated spare inventory, which significantly contributed to the >60% reduction in downtime reported in Section 5.5.
5.7 Summary of Validation Outcomes:
Following four refurbishment cycles over a two-year period, all CG membranes underwent rigorous performance evaluation against critical GMP-aligned parameters. Validation testing included surface tension, airflow velocity, pressure hold, and visual inspection. Results confirmed that the prescriptive maintenance strategy met or exceeded operational standards. The outcomes are summarized below:
Test / Parameter | OEM Standard | Refurbished Result | Status |
Surface Tension (N/cm) | 5–7 | 5.0–7.0 across forty-four refurbishments | Within Spec |
Pressure Hold (60 sec @ 1 bar) | No measurable drop | Passed (0 failures across 4 cycles) | Compliant |
Airflow Uniformity | ±10% of baseline, laminar flow | Confirmed via airflow probes and smoke study | Compliant |
Visual Inspection | No tears, seal flatness, no debris | All units passed pre-installation QC | Acceptable |
Cost Efficiency | $110,000 per cycle | $50,000 per cycle | 55% Savings |
Downtime Reduction | ~12 weeks lead time | 3–4 weeks turnaround | 60–70% Saved |
6. Discussion
This study demonstrates the feasibility and impact of implementing a prescriptive maintenance framework for CG membranes within pharmaceutical isolators. Unlike traditional reactive or time-based replacement strategies, the prescriptive model leverage’s objective performance indicators to drive timely, risk-based interventions. The results not only validated the refurbished membranes across critical GMP parameters—airflow, surface energy, and pressure containment—but also revealed significant operational advantages in cost savings and downtime reduction.
A key insight from this study is the effectiveness of multi-parameter monitoring as a predictive tool. For instance, while most membranes-maintained airflow and surface tension within acceptable thresholds, visual anomalies such as VHP pooling and edge seal discoloration provided early cues of degradation. These indicators were not captured by standard instrumentation alone but were incorporated into a structured decision matrix (Green–Yellow–Red) that enabled initiative-taking scheduling of refurbishments before functional failure occurred. This reduced the likelihood of unscheduled isolator shutdowns, which typically incur batch delays, increased QA investigations, and high replacement lead times.
Furthermore, the refurbishment approach maintained GMP validation standards across all four refurbishment cycles. Pressure decay testing revealed no measurable leak in any refurbished membrane, and airflow uniformity remained within ±10% of baseline as verified through both quantitative probes and smoke studies. This compliance indicates that membrane material properties and sealing integrity were preserved post-refurbishment.
Operationally, the shift from full OEM replacement to in-house or vendor-assisted refurbishment reduced direct costs by approximately 55% and saved 60–70% in lead time. Two additional membrane sets were proactively refurbished and held in validated inventory, further reducing supply risk and enabling just-in-time swaps during routine maintenance windows.
These outcomes underscore the strategic value of prescriptive maintenance in pharmaceutical operations. By integrating engineering controls, visual assessment, and data-driven thresholds, the framework aligns with ICH Q9 principles of risk management and lifecycle quality assurance. Additionally, this methodology supports environmental sustainability by extending component life cycles and reducing material waste.
The prescriptive maintenance model established here can serve as a blueprint for other critical components in aseptic manufacturing, including glove ports, air handling filters, and door seals. Scaling this framework across facilities could result in standardized reliability metrics, predictive analytics integration, and broader digital transformation within GMP environments.
7.CONCLUSION
This study presents a validated prescriptive maintenance framework tailored for CG membranes in pharmaceutical isolators, offering a pragmatic shift from traditional replacement cycles to data-driven refurbishment planning. By integrating multiple indicators—surface tension, airflow velocity, pressure decay behavior, visual inspection, and sterilization exposure count—this model enabled early identification of membrane performance degradation before functional failure occurred.
Across four refurbishment cycles involving 44 membrane units, all refurbished components met or exceeded OEM standards. The program delivered a 55% reduction in direct costs (from $110,000 to $50,000 per cycle) and shortened lead time by over 60%, enabling interventions during scheduled maintenance without production impact. Critically, GMP compliance was fully retained, with no observed deviations or sterility failures across any batch involving refurbished membranes.
The use of a structured traffic-light decision matrix allowed clear classification of membrane health and optimized planning of maintenance events. This minimized isolator downtime, reduced regulatory risk, and ensured operational continuity. Additionally, refurbishment extended the usable lifecycle of high-cost components, supporting sustainability goals through reduced material waste and inventory burden.
Beyond the immediate cost and reliability benefits, this approach sets a precedent for scalable prescriptive maintenance in sterile manufacturing. It aligns with modern quality risk management frameworks (ICH Q9), digital QMS strategies, and advanced reliability-centered maintenance practices. As such, it provides a foundational model for broader adoption across pharmaceutical production environments.
8. Future Work
Building on the success of the current prescriptive maintenance strategy for CG membranes, future enhancements will focus on integrating advanced technologies to elevate precision, responsiveness, and scalability. One key avenue is the deployment of compact, non-invasive sensor technologies that enable real-time monitoring of critical membrane parameters. Embedding sensors—such as airflow probes, humidity detectors, or surface energy sensors—directly into isolator airflow paths or membrane housing could provide continuous, high-resolution data streams. This would reduce dependence on periodic manual inspections and allow for instant detection of subtle degradation patterns, improving maintenance responsiveness.
In parallel, the integration of AI-driven predictive analytics represents a transformative next step. Historical performance data—including membrane aging curves, sterilization frequency, airflow deviations, and VHP pooling instances—can be used to train machine learning models capable of forecasting performance decline with high accuracy. By correlating minor parameter shifts with eventual failures, these models could preemptively trigger alerts or auto-generate maintenance work orders within Computerized Maintenance Management Systems (CMMS). Together, these technologies would enable a fully autonomous, self-correcting maintenance ecosystem, enhancing equipment reliability, minimizing human error, and aligning with the broader goals of digital transformation and Pharma 4.0.
9. Declarations
Funding
This research received no specific grant from any funding agency in the public, commercial, or not-for-profit sectors.
References
1. Guidance for Industry on Sterile Drug Products Produced by Aseptic Processing-Current Good Manufacturing Practice. (2004, October 4). Federal Register. https://www.federalregister.gov/documents/2004/10/04/04-22207/guidance-for-industry-on-sterile-drug-products-produced-by-aseptic-processing-current-good.
2. Eudralex Volume 4 - EU Guidelines for Good Manufacturing Practice for Medicinal Products for Human and Veterinary Use. (n.d.). Health.ec.europa.eu. https://health.ec.europa.eu/latest-updates/eudralex-volume-4-eu-guidelines-good-manufacturing-practice-medicinal-products-human-and-veterinary-2022-02-21_en.
3. for, O. (2025). ISO 14644-5:2025. ISO. https://www.iso.org/standard/88599.html.
4. Affairs, O. of R. (2019). Aseptic Processing and Packaging for the Food Industry. FDA. https://www.fda.gov/inspections-compliance-enforcement-and-criminal-investigations/inspection-guides/aseptic-processing-and-packaging-food-industry.
5. Akers, J. (2011, May). Clean Rooms, RABS, and Isolators: Validation and Monitoring in the Diverse World of Aseptic Processing. Americanpharmaceuticalreview.com. https://www.americanpharmaceuticalreview.com/Featured-Articles/36878-Clean-Rooms-RABS-and-Isolators-Validation-and-Monitoring-in-the-Diverse-World-of-Aseptic-Processing/
6. Optimizing Pharmaceutical Isolator Design | Germfree. (2023). Germfree. https://www.germfree.com/insights/optimizing-pharmaceutical-isolator-design/
7. Scaffidi, L., & Ingelheim, B. (n.d.). Airflow Visualization / Aseptic Process Simulation GMP/FDA Compliance Conference. https://www.pharma-congress.com/files/userFiles/Presentations/Day2/Compliance-Conference/03_Scaffidi_Gavranovic_Airflow_Visualization_APS.pdf
8. Lehmann, F. M., & Bühler, T. H. (2023). Advanced Aseptic Pharmaceutical Production in a Scalable Isolator A Case Study. ResearchGate, 13(2), 86–91. https://www.researchgate.net/publication/370006501_Advanced_Aseptic_Pharmaceutical_Production_in_a_Scalable_Isolator_A_Case_Study
9. Nieskes, R. & Templeton, P. (2005). Isolator Leak and Pressure Hold Testing Protocols
10. McBride, B. (2023). Bio-Decontamination Validation in NHS Isolators
11. PIC/S PI 007-6. Isolator Technology Guidance
12. ISPE Barrier Isolator Forums (2023)
13. Pharmaceutical Isolator | Safe Aseptic Filling. (n.d.). Www.syntegon.com. https://www.syntegon.com/solutions/pharma/pharmaceutical-isolator-and-barrier-systems/
14. Optima packaging group. (2025). Optima-Packaging.com. https://www.optima-packaging.com/en/newsroom/press/press-releases/optima-packaging-group-continues-to-grow-and-strengthens-presence-in-the-u.s
15. Isolator Surfaces and Contamination Risks to Personnel. (n.d.). Www.pda.org. https://www.pda.org/pda-letter-portal/home/full-article/isolator-surfaces-and-contamination-risks-to-personnel
16. Sepideh Alavi-Moghadam, Masoumeh Sarvari, Goodarzi, P., & Hamid Reza Aghayan. (2020, February 6). The Importance of Cleanroom Facility in Manufacturing Biomedical Products. https://doi.org/10.1007/978-3-030-35626-2_7
17. Xu, Z. (2013). Fundamentals of Air Cleaning Technology and Its Application in Cleanrooms. In Springer eBooks. Springer Nature. https://doi.org/10.1007/978-3-642-39374-7
18. Devon Roshan Eisner, Hubbard, A., Eppler, K., Vassia Tegoulia, & Maa, Y. (2019). Vapor-Phase Hydrogen Peroxide Uptake by Silicone Tubing and Primary Packaging Components during Protein Drug Product Aseptic Filling: Impact of Pretreatment and Sterilization Process. Pda Journal of Pharmaceutical Science and Technology, 73(5), 443–458. https://doi.org/10.5731/pdajpst.2019.009928
19. DeBellis, M.P. (2004). Design for Reuse in Aseptic Environments
20. Sz Pharma. (2024, October 30). The Role of AI in Enhancing Clean Room Management. Sz-Pharma.com. https://www.sz-pharma.com/a-the-role-of-ai-in-enhancing-clean-room-management.html
21. IEEE Xplore Full-Text PDF: (2025). Ieee.org. https://ieeexplore.ieee.org/stamp/stamp.jsp?arnumber=10659836
22. Vora, L. K., Gholap, A. D., Jetha, K., Thakur, R. R. S., Solanki, H. K., & Chavda, V. P. (2023). Artificial Intelligence in Pharmaceutical Technology and Drug Delivery Design. Pharmaceutics, 15(7), 1916–1916. NCBI. https://doi.org/10.3390/pharmaceutics15071916
23. Bhattacharya, A., Saleh, M., Shervin Shoai-Naini, Betz, F., & Mousavi, E. (2023). A Systematic Literature Review of Cleanroom Ventilation and Air Distribution Systems. Aerosol and Air Quality Research, 23(7), 220407–220407. https://doi.org/10.4209/aaqr.220407
24. Chang, Y., Zong, J., Hu, Y., Ai, Z., Zhang, W., Zhao, W., Liu, Z., & Zhang, R. (2025). Data-driven modeling and sensitivity analysis of pressure differential deviations in pharmaceutical cleanrooms under static conditions and dynamic disturbances. Building Simulation. https://doi.org/10.1007/s12273-025-1305-z
25. Mallioris, P., Aivazidou, E., & Bechtsis, D. (2024). Predictive maintenance in Industry 4.0: A systematic multi-sector mapping. CIRP Journal of Manufacturing Science and Technology, 50, 80–103. https://doi.org/10.1016/j.cirpj.2024.02.003
26. Chen, Y., Yang, O., Sampat, C., Bhalode, P., Ramachandran, R., & Ierapetritou, M. (2020). Digital Twins in Pharmaceutical and Biopharmaceutical Manufacturing: A Literature Review. Processes, 8(9), 1088. https://doi.org/10.3390/pr8091088
27. Siraskar, R., Kumar, S., Patil, S., Bongale, A., & Kotecha, K. (2023). Reinforcement learning for predictive maintenance: a systematic technical review. Artificial Intelligence Review. https://doi.org/10.1007/s10462-023-10468-6
28. Siemens. (2024). Digital Twin. Siemens.com Global Website. https://www.siemens.com/global/en/products/automation/topic-areas/digital-enterprise/digital-twin.html
29. Asset Performance Management - Maximo Application Suite | IBM. (n.d.). Www.ibm.com. https://www.ibm.com/products/maximo/asset-performance-management
30. Foivos Psarommatis, & May, G. (2025). A Cost–Benefit Model for Sustainable Product Reuse and Repurposing in Circular Remanufacturing. Sustainability, 17(1), 245–245. https://doi.org/10.3390/su17010245.
31. OpenAI. (2025). ChatGPT. ChatGPT; OpenAI. https://chatgpt.com/
Authors
Retracted by Author


Comments