- lauraclark849
- Dec 9, 2025
- 12 min read
Updated: Jan 15
Peer Review Article | Open Access | Published 18th December 2025
Finding an accurate equation to estimate the osmolarity of parenteral nutrition for preterm baby
Oktavia Indrati¹, Ridho Rizky Putra Rosadi², Suci Hanifah³* | EJPPS | 304 (2025) | https://doi.org/10.37521/ejpps30405
Abstract
Background: Determining the osmolarity of parenteral nutrition (PN) preparations is essential to guide the administration route—whether via peripheral or central venous access.
Objective: This study aimed to identify the most accurate formula for calculating PN osmolarity compared with measurements obtained using a refractometer.
Methods: An exploratory study was conducted using formulae, ingredients, and procedures routinely applied for premature infants at a Public Hospital in Indonesia. Twelve PN formulae were prepared, comprising six standard PN formulae for premature infants weighing 1.0 kg and six standard PN formulae for those weighing 1.5 kg. Variations in nutrient concentrations within each formula reflected the requirements for the first, second, and third days of PN administration. Osmolarity was measured using a refractometer. The refractometer results were compared with predicted values calculated using formulae recommended in clinical guidelines. Differences between measured and calculated values were analysed using ANOVA in SPSS version 23, and accuracy was assessed using the Mean Absolute Percentage Error (MAPE) method.
Results: The MAPE analysis indicated that equation 2 had the smallest error rate (19%). Statistical testing revealed no significant difference between refractometer measurements and calculations based on equation 2. Calculations using equation 2 consistently yielded higher osmolarity values compared to those obtained through refractometric measurements. Considering the clinical guideline that medications with high osmolarity must be administered via a central vein, the use of equation 2 provides a more cautious and thus safer estimation. This is good result, allowing better anticipation of the effect of the wrong way of administration.
Conclusion: The equation (Amino acids (%) × 100) + (Glucose (%) × 50) + (Calcium (mEq/L) × 1.4) + (Magnesium (mEq/L) × 1) + (Potassium (mEq/L) × 2) + (Sodium (mEq/L) × 2) yielded the most accurate osmolarity predictions for PN in a premature baby. The existing equation for calculating the osmolarity of parenteral nutrition formulations for preterm babies remains insufficiently precise and therefore requires further development to ensure greater accuracy in various clinical applications.
Keywords: Osmolarity Equation, Parenteral Nutrition, Premature, Infant, Refractometer
1. Introduction
Parenteral nutrition (PN) for patients in intensive care units (ICUs) is critically important, particularly for premature infants and those with low birth weight¹. The guidelines recommend initiating PN as soon as possible for premature infants, provided venous access is available². PN administration can prevent catabolism, promote growth, reduce insulin resistance, and prevent neurological and cardiovascular complications in premature infants¹⁻⁴. PN has been shown to be safe and does not increase the risk of electrolyte imbalance, refeeding syndrome, sepsis, or other adverse outcomes¹,².
Data from major hospitals indicate that the monthly demand for compounded PN formulations exceeds 300 preparations, with individualization based on body weight and nutritional status⁴. In general, PN formulation from hospital results in good stability, but causes high osmolarity due to the large number of dissolved components, particularly macronutrients⁵,⁶. High-osmolarity parenteral solutions must be administered via central venous access, as peripheral infusion can cause phlebitis, erythema, and infiltration⁷. Furthermore, solutions with osmolarity exceeding 800–900 mOsm/L are generally unsuitable for peripheral administration due to the risk of vascular irritation or damage. However, they can be safely administered through a central venous route, where higher blood flow allows rapid dilution and reduces the likelihood of complications⁸. Errors in determining osmolarity can lead to inappropriate selection of the administration route—peripheral or central. Conversely, assuming that all PN formulations should be administered through a central venous catheter (CVC) is not an effective solution. Although CVC administration is generally safer for hyperosmolar solutions, it carries a higher risk of infection and mechanical complications, including thrombosis, embolism, and catheter occlusion⁹. In addition, CVC placement requires specific technical expertise, is more expensive, and demands more frequent maintenance¹⁰. Therefore, accurate determination of PN osmolarity is of critical importance¹¹.
Osmolarity measurement using a standard osmometer provides excellent accuracy¹². Refractometers have been shown to offer comparable accuracy at a lower cost and with simpler methodology¹². A refractometer is a reasonably accurate instrument based on the principle of light refraction. When light passes from one medium to another with a different density, it bends or refracts; the degree of bending is expressed as the refractive index, commonly reported as the Brix value (BV). However, in practice, both approaches (osmometer and refractometer) are not feasible because few hospitals possess either instrument. Additionally, due to workload and time constraints, it is impractical to measure osmolarity for every PN formulation, particularly since PN preparation is typically individualized according to the patient’s clinical condition and nutritional requirements—resulting in unique formulae and osmolarity values for each patient¹³. Consequently, routine measurement of osmolarity for all parenteral nutrition (PN) preparations is not practically feasible and osmolarity is typically estimated using predictive equations or calculation formulae¹⁴. Several equations are familiar to hospital practitioners for estimating PN osmolarity (Table 1), but validation studies remain scarce¹²,¹⁵. Chang¹² reported that the predictive accuracy of osmolarity calculation formulae for parenteral nutrition formulations was validated by comparison with empirically determined values. Chang et al. evaluated the accuracy of osmolarity prediction formulae against refractometer measurements in formulations with high glucose and sodium content, whereas Zanuy et al. examined formulae with high sodium and chloride content. To date, no study has assessed prediction formulae for PN intended for premature infants with low birth weight, which typically contain high concentrations of glucose and amino acids. The findings of this study are expected to yield practical recommendations for hospital practitioners on the most reliable formula for predicting the osmolarity of parenteral nutrition in premature infants¹²,¹⁶.
2. Method
2.1. Parenteral Nutrition Formulation
PN was prepared in the Pharmaceutical Technology Laboratory, Department of Pharmacy, Universitas Islam Indonesia, following formulations used in hospitals for premature infants. The PN composition consisted of: Aminosteril® Infant 6% (Fresenius Kabi Combiphar, Indonesia), water for injection (Ikapharmindo, Indonesia), glucose 5% (Otsuka Indonesia, Indonesia), glucose 40% (Otsuka Indonesia, Indonesia), NaCl 3% (Otsuka Indonesia, Indonesia), potassium chloride injection 7.46% (Otsuka Indonesia, Indonesia), calcium gluconate injection (Ethica Industri Farmasi, Indonesia), magnesium sulphate injection 20% (Otsuka Indonesia, Indonesia), and Lipofundin® 20% (B. Braun).
2.2. Study Procedure
2.2.1. Preparation of PN Formulations
The formulations used in this study were PN regimens for premature infants weighing 1.0 kg (Formulas 1–6) and 1.5 kg (Formulas 7–12), representing the minimum and maximum nutrient concentrations for Day 1, Day 2, and Day 3 (Table 1).
Table 1. Total parenteral nutrition formulations for premature infants, analysed according to hospital-based formulations.

Notes:
a lowest osmolarity formula
b highest osmolarity formula
F1: Day 1 formulation, 1.0 kg infant, minimum concentration.
F2: Day 1 formulation, 1.0 kg infant, maximum concentration.
F3: Day 2 formulation, 1.0 kg infant, minimum concentration.
F4: Day 2 formulation, 1.0 kg infant, maximum concentration.
F5: Day 3 formulation, 1.0 kg infant, minimum concentration.
F6: Day 3 formulation, 1.0 kg infant, maximum concentration.
F7: Day 1 formulation, 1.5 kg infant, minimum concentration.
F8: Day 1 formulation, 1.5 kg infant, maximum concentration.
F9: Day 2 formulation, 1.5 kg infant, minimum concentration.
F10: Day 2 formulation, 1.5 kg infant, maximum concentration.
F11: Day 3 formulation, 1.5 kg infant, minimum concentration.
F12: Day 3 formulation, 1.5 kg infant, maximum concentration
2.2.2. Osmolarity Determination by Predictive Equations
Table 2. The references for osmolarity and the equation
Equation | References | Osmolarity Equation |
Equation 1 | Pereira Da Silva Equation | (Amino acids (g/L) × 8) + (glucose (g/L) × 7 )+ (sodium (mEq/L) × 2) + (phosphate (mg/L) × 0.2) – 50 |
Equation 2 | ASPEN practice manual equation | (Amino acids (%) × 100) + (glucose (%) × 50) + (calcium (mEq/L) × 1.4) + (magnesium (mEq/L) × 1) + (potassium (mEq/L) × 2) + (sodium (mEq/L) × 2) |
Equation 3 | ASPEN guidelines equation | (Dextrose (g/L) × 5) + (amino acids (g/L) × 10) + (fat (g/L) × 0.71) + (electrolytes (mEg/L) × 1) |
2.2.3. Determination of Osmolarity Using a Refractometer
The refractometer was calibrated using two drops of distilled water. Following calibration, the sample compartment was cleaned, and two drops of the PN solution were placed onto the sample stage. The refractometer measurement results were expressed as Brix values.
2.2.4. Statistical Analysis
Results are presented as mean ± standard deviation. To determine the most accurate equation, osmolarity values obtained from the predictive equations and from the refractometer measurements were analysed using ANOVA in SPSS version 23. A multivariate significance value greater than 0.05 was considered indicative of no significant difference. Additionally, the Mean Absolute Percentage Error (MAPE) was calculated, with values closer to zero indicating greater predictive accuracy.
3. Results and Discussion
Osmolarity Measurements Using a Refractometer
Osmolarity measurements obtained using the refractometer ranged from 500 to 900 mOsm/L. The lowest osmolarity value was observed in F5 (591.51 mOsm/L), whereas the highest value was recorded in F8 (925.97 mOsm/L) (Table 3).

Statistical analysis showed no significant difference between the refractometer measurements and the calculated osmolarity values obtained using equations 2 and 3 (p > 0.05). In contrast, comparison between refractometer measurements and equation 1 yielded a p-value of 0.020 (< 0.05), indicating a statistically significant difference. Based on the Mean Absolute Percentage Error (MAPE) analysis, equation 2 provided the closest approximation to the actual values, with the smallest percentage error of 19%.
Table 4. Comparison of refractometer values with calculated values from predictive equations.
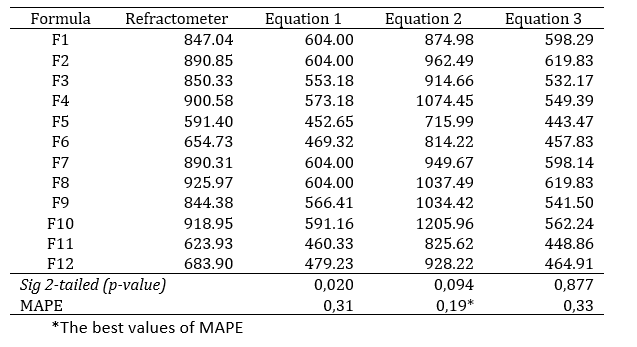

Based on the findings of this study, equation 2 most closely represented the osmolarity values obtained using the refractometer. Figure 1 further illustrates that the osmolarity values calculated using equation 2 most closely approximate the refractometer measurements, although with a tendency toward slightly higher values.
Discussion
The nutrients examined in this study meet the requirements of premature infants in the first days of life. This aims to achieve linear growth targets and prevent flat growth or growth faltering¹⁷. Meeting these minimum targets helps restore postnatal weight loss, thereby supporting optimal physical and brain development. Nutritional regimens of this tested PN contains macronutrients with a balanced level of glucose and amino acids. Macronutrient intake is essential to prevent hidden hunger and its long-term consequences, characterised by multiple nutrient deficiencies, impaired growth and organ dysfunction³. Glucose in PN prevents growth failure, hypercatabolism, growth and development disorder in neonates. Adequate protein intake can prevent catabolism and maintain nitrogen balance, thereby supporting growth and development. Insufficient protein intake in the early postnatal period may impair cognitive development, proportionally to the degree of growth restriction. Additional benefits of adequate protein provision include improved glucose tolerance and a reduced risk of hyperglycaemia through stimulation of endogenous insulin secretion and gluconeogenesis¹⁸,¹⁹. Meanwhile, the electrolyte composition for preterm infants in this PN included adequate amounts of sodium, calcium, potassium, and magnesium. Controlled sodium intake in premature infants has been associated with a reduction in oxygen requirements and a lower risk of bronchopulmonary dysplasia²⁰. Insufficient sodium intake may also impair neurocognitive development. The sodium content of human breast milk declines markedly after the first day postpartum¹⁷. In addition, hypomagnesemia can precipitate the development of hypocalcaemia.²¹.
The total amount of dissolved nutrients in parenteral nutrition has a substantial impact on the solution’s osmolarity. The osmolarity of a solution, such as parenteral nutrition, is strongly influenced by its molarity: the greater the number of solute molecules, the higher the osmolarity. Similarly, a greater degree of solute ion dissociation further increases osmolarity. One osmole is defined as the amount of solute that, when dissolved in one liter of solution, yields one mole of osmotically active particles. With a composition of more than 4 grams of glucose and amino acids combined with various dissolved electrolytes in an aqueous solvent of less than 100 mL, the preparation becomes highly hyperosmolar. This condition results in the osmolarity of parenteral nutrition (PN) being approximately two to three times higher than that of blood plasma. The result of refractometer measurements indicated that formulations of tested PN with higher concentrations of amino acids, calcium, and magnesium produced higher osmolarity values.
Based on the ANOVA statistical test, formulae 2 and 3 can be applied to predict the osmolarity values of parenteral nutrition (PN), as they did not produce results significantly different from those obtained with the refractometer (p>0.05). Furthermore, according to the MAPE analysis, equation 2 yielded the closest approximation to the actual osmolarity, with the smallest percentage error. The use of MAPE provided a more robust interpretation of prediction accuracy and is particularly suitable when the predicted values are non-zero¹⁷. MAPE analysis is frequently employed in practice because it provides an intuitive interpretation of relative error, provided that the measured value is above zero²². These results are consistent with previous reports, which found MAPE values ranging from 24% to 28% for equation 1 and from 9.5% to 20.8% for equation 2¹⁵. Zanuy’s study recommended equation 3, as it demonstrated the lowest MAPE value (5%). However, that study utilized formulations with high sodium and chloride content. In contrast, the formulations in the present study contained balanced proportions of amino acids and glucose, with relatively low electrolyte concentrations.
In practice, using equation 2 is safer than equation 1 and 3. The osmolarity values calculated using equation 2 were consistently higher than those measured by the refractometer. This outcome is considered safer and more precautionary compared with equations 1 and 3. The calculated values were approximately 100–200 mOsm higher than the actual measurements, which can be considered safe given the variability in recommended osmolarity thresholds for central administration. The Infusion Nurses Society (INS) guidelines suggest a cutoff of 600 mOsm, whereas other guidelines recommend a limit of 800 mOsm.
Compared with similar studies, the present investigation produced different results, favouring equation 3 over equations 1 and 2¹⁵. This discrepancy may be attributable to differences in nutrient composition. In equation 2, the calculated components include amino acids, glucose, calcium, magnesium, potassium, and sodium. In previous studies, the nutrient composition was more varied, including additional vitamins and trace elements¹². In the present study, the PN formulations analysed contained components explicitly accounted for in equation 2, except for lipids. Among these, the largest osmolarity contributions were derived from glucose, amino acids, sodium, and magnesium. Although Zanuy¹⁵ demonstrated the validity of all three equations, the calculated osmolarity values tended to be underestimated compared to those obtained using an osmometer. This is in line with this study for equation 1 and 3. Meanwhile, the present study found that formula 2 yielded overestimated results relative to refractometric measurements. This discrepancy can be attributed to the high proportion of macronutrients compared with micronutrients in the formulation. According to Chang¹⁵, refractometric measurement and Brix value determination provide more accurate estimations for parenteral nutrition solutions rich in glucose and amino acids. Therefore, the selection of an osmolarity calculation formula should take into account the compositional similarity of the formulation being evaluated. Otherwise, the most accurate determination should be obtained through direct measurement using appropriate analytical instruments. However, given that such instruments are not available in most clinical settings, the proposed equation offers a rapid and straightforward method for estimating the osmolarity of neonatal PN solutions, thereby enabling more accurate decisions regarding the choice of administration route and infusion rate.
4. Conclusion
Based on refractometer measurements and MAPE analysis, equation 2 was found to be the most accurate method for estimating the osmolarity of parenteral nutrition formulations for premature infants containing glucose, amino acids, lipids, sodium, calcium, magnesium, and potassium. Healthcare practitioners can apply equation 2 to predict osmolarity values, thereby determining whether central venous access is necessary for administration.
Acknowledgments
The authors gratefully acknowledge the Directorate of Research and Community Service (Direktorat Penelitian dan Pengabdian Masyarakat, DPPM), Universitas Islam Indonesia, for funding this study through the Penelitian Madya grant scheme.
References
1. Nagel EM, Gonzalez V JD, Bye JK, Super J, Demerath EW, Ramel SE. Enhanced parenteral nutrition is feasible and safe in very low birth weight preterm infants: a randomized trial. Neonatology. 2023;120(2):242-9.
2. Robinson DT, Calkins KL, Chen Y, Cober MP, Falciglia GH, Church DD, et al. Guidelines for parenteral nutrition in preterm infants: The American Society for Parenteral and Enteral Nutrition. Journal of Parenteral and Enteral Nutrition. 2023;47(7):830-58.
3. Goldberg DL, Becker PJ, Brigham K, Carlson S, Fleck L, Gollins L, et al. Identifying Malnutrition in Preterm and Neonatal Populations: Recommended Indicators. Journal of the Academy of Nutrition and Dietetics. 2018;118(9):1571-82.
4. Sari CP, Hanifah S, Wibowo, T, Nita AA. Parenteral Nutrition and Weight Gain Outcome for Neonates in the Intensive Care Unit. European Journal of Clinical Pharmacy. 2022;24(4):208-13.
5. Hanifah S, Maulidani Y, Nugroho BH, Sari CP. Provision of standardized all-in-one parenteral nutrition (AIO-PN) for very preterm neonates: Evaluation at room and cold temperatures. Journal of Pharmacy and Bioallied Sciences. 2021;13(1):26-30.
6. Hanifah S, Maulidani Y, Nugroho BH, Sari CP. All-in-one versus lipid-free parenteral nutrition for premature infants: visual, pH, and particle size analyses. Nutr Hosp. 2019;36(6):1-4.
7. Ballesteros-Peña S, Fernández-Aedo I, Vallejo-De la Hoz G, Tønnesen J, Miguelez C. Identification of potentially irritating intravenous medications. Enfermería Intensiva (English ed). 2022;33(3):132-40.
8. Fewtrell M, Bronsky J, Campoy C, Domellöf M, Embleton N, Mis NF, et al. Complementary feeding: a position paper by the European Society for Paediatric Gastroenterology, Hepatology, and Nutrition (ESPGHAN) Committee on Nutrition. Journal of pediatric gastroenterology and nutrition. 2017;64(1):119-32.
9. Tian L, Li W, Su Y, Gao H, Yang Q, Lin P, et al. Risk factors for central venous access device-related thrombosis in hospitalized children: a systematic review and meta-analysis. Thrombosis and Haemostasis. 2021;121(05):625-40.
10. Ullman AJ, Gibson V, Takashima MD, Kleidon TM, Schults J, Saiyed M, et al. Pediatric central venous access devices: practice, performance, and costs. Pediatric Research. 2022;92(5):1381-90.
11. Teja B, Bosch NA, Diep C, Pereira TV, Mauricio P, Sklar MC, et al. Complication rates of central venous catheters: a systematic review and meta-analysis. JAMA Internal Medicine. 2024;184(5):474-82.
12. Chang WK, Yeh MK. Prediction of parenteral nutrition osmolarity by digital refractometry. Journal of Parenteral and Enteral Nutrition. 2011;35(3):412-8.
13. Ray S. NICE guideline review: Neonatal parenteral nutrition (NG154). Archives of Disease in Childhood-Education and Practice. 2021;106(5):292-5.
14. Mihatsch W, Jiménez Varas MÁ, Diehl LL, Carnielli V, Schuler R, Gebauer C, et al. Systematic Review on Individualized Versus Standardized Parenteral Nutrition in Preterm Infants. Nutrients. 2023;15(5):1224.
15. Zanuy MV, Bravo SP, Cebas AL, Sánchez JG, Muñóz PG, Villares JM, et al. Agreement between different equations to estimate osmolarity of parenteral nutrition solutions. Nutricion hospitalaria. 2015;32(6):2757-62.
16. Siervo M, Bunn D, Prado CM, Hooper L. Accuracy of prediction equations for serum osmolarity in frail older people with and without diabetes. The American journal of clinical nutrition. 2014;100(3):867-76.
17. Belfort MB, Ehrenkranz RA, editors. Neurodevelopmental outcomes and nutritional strategies in very low birth weight infants. Seminars in Fetal and Neonatal Medicine; 2017: Elsevier.
18. Yailian A-L, Serre C, Fayard J, Faucon M, Thomaré P, Filali S, et al. Production and stability study of a hospital parenteral nutrition solution for neonates. Journal of pharmaceutical analysis. 2019;9(2):83-90.
19. Beal T, Tumilowicz A, Sutrisna A, Izwardy D, Neufeld LM. A review of child stunting determinants in Indonesia. Maternal & child nutrition. 2018;14(4):e12617.
20. Jochum F, Moltu SJ, Senterre T, Nomayo A, Goulet O, Iacobelli S, et al. ESPGHAN/ESPEN/ESPR/CSPEN guidelines on pediatric parenteral nutrition: fluid and electrolytes. Clinical Nutrition. 2018;37(6):2344-53.
21. Thomas N. Nutritional care of preterm infants: scientific basis and practical guidelines. Medknow; 2016.
Authors
Oktavia Indrati¹, Ridho Rizky Putra Rosadi², Suci Hanifah³*
¹Pharmacy, Universitas Islam Indonesia
²YAP Hospital, Yogyakarta, Indonesia
³*Universitas Islam Indonesia
* Corresponding author:
Suci Hanifah suci.hanifah@uii.ac.id


Comments