- nicolasribeiro3
- Dec 18, 2023
- 7 min read
Updated: Feb 26, 2024
Peer Review Article | Open Access | Published 20th December 2023
Enzymatic Indicators in Vaporized Hydrogen Peroxide Decontamination Cycles: Application-related Research focusing on Fractional Kill Time (FKT) and Reverse Fractional Kill Time (RFKT) Studies
Airin Franke(1),(2), Birte Scharf (3), Karin Mittmann (4), Marina Gole(3)* | EJPPS | 284 (2023) | https://doi.org/10.37521/ejpps.28403 | Click to download pdf
ABSTRACT
The accepted standard from a regulatory perspective for vaporized hydrogen peroxide (vH2O2) cycle validation is the use of biological indicators (BIs). Novel enzymatic indicators (EIs) are gaining more importance in this field, relying on specific enzymatic reactions for their functionality. The aim of this work is to determine how enzymatic indicators can contribute to the cycle development process. Emphasis was placed on the initial informative study, the fractional kill time study, which is a basis for future studies. The results indicate that enzymatic indicators have the potential to facilitate further development of the cycle. This requires an analysis of the determined data, measured in relative light units (RLU), and aligning it with the BI growth, resulting in Full Kill/ No Kill limits. The use of enzymatic indicators for decontamination cycle development opens new perspectives and holds considerable potential for practical use in the development and validation of decontamination processes.
INTRODUCTION
In the vH2O2 decontamination processes within barrier systems, recent developments are exploring the potential of enzymatic indicators as a novel approach distinct from conventional biological indicators. EIs are used to measure enzymatic deactivation through vH2O2 in relative light units. The theoretical basis relies on the Luciferin-Luciferase reaction, a mechanism that has been elucidated in previous studies [1], [2]. The manufacturing process and composition have been described in other papers [3], [4]. For detection of light units, the EIs are placed in sample tubes in a luminometer.
A study conducted within a sterility testing isolator highlights the emerging role of EIs, in providing fast and quantitative evaluation of vH2O2 decontamination cycles [5]. This innovative approach presents an opportunity to address the limitations associated with BIs and allowing real-time adjustments for enhanced efficiency in pharmaceutical manufacturing. Furthermore, recent studies have demonstrated the efficacy of EIs in identifying critical positions within production isolators. These investigations, as documented in [6], substantiate the practical application of EIs in large-scale pharmaceutical manufacturing environments. Moreover, other studies have employed EIs to compare them with BIs and establish correlations, further contributing to the understanding and validation of a potential benefit of EIs in pharmaceutical manufacturing environments [7].
Recent developments demonstrate a growing interest in utilizing EIs for decontamination cycle development. While these indicators offer promising quantitative results and a basis for future developments, their translation into practical application remains a challenge. In particular, the use in Fractional Kill Time studies (FKT), which determine the cycle time point at which the BIs are inactivated is of central interest. In a FKT study, the investigation focuses on determining the time point when the biological indicators are eliminated, measured from the start of the gassing cycle. From the data to be determined, a sequence of eradication can be generated, providing insights into the speed at which inactivation occurs within the isolator. In other studies, FKT Studies have been conducted by removing indicators through methods such as mouseholes during the gassing cycle. Such an approach is not safe and often not feasible for production isolators.
This paper shows how combined FKTs with EIs and BIs can be performed in isolators. It demonstrates how the data obtained can be used to computationally determine a correlation between the killing of BIs and the inactivation of EIs. A mathematical calculation has been developed to simply translate the difficult-to-imagine RLU values into a system-specific log reduction.
Experimental Design
All cycles were performed using the Sterility Test Isolator (STI 4, Franz Ziel GmbH). The isolator is equipped with a Biodecontamination System BDS 12/60 from Franz Ziel. The gassing parameters ensure the saturation of the isolator with H2O2 followed by a 15-minute aeration phase.
The FKT studies with enzymatic indicators were conducted concurrently with FKT studies using BIs. The underlying principle of this FKT study has been previously discussed [8] . For each time point of the FKT, one EI was prepared. The exposure to vH2O2 was stopped by transferring the EIs using forceps into a Falcon tube containing 2 mL of distilled water to completely covered the EI by water at each time point. The first FKT time point commenced one minute after the gassing start, similar the procedure with BIs. After sealing the tubes, they remained in the isolator until the end of the cycle and were subsequently measured. Prior to the measurement, the EIs were retrieved from the water using forceps and placed in sample tubes for approximately five minutes.
In the case of reverse FKT studies (RFKT), the EIs were attached to the inner side of Falcon Tube lids using masking tape and placed within the isolator. BIs were wrapped in aluminum foil. After three minutes of gassing and the attainment of saturation phase, one Falcon Tube was opened every minute, exposing the EIs sequentially to the isolator environment. The opened EIs remained in the isolator until the end of the cycle and were subsequently read with the luminometer. Simultaneously, a similar procedure was applied to the BIs, with the aluminum foil being removed at each corresponding time point.
RESULTS
The bars in figures 1 and 2 represent the mean standard deviations of RLU values from EIs, BI results are presented as blue squares. During both, FKT and RFKT, the results indicate that the EI inactivation has a sigmoidal curve. The relation between enzyme deactivation and BI inactivation can be used to establish critical threshold ranges (No Kill and Full Kill limits) based on RLU measurements from enzymatic indicators. These threshold ranges effectively categorize RLU values, indicating inadequately deactivated (above No Kill limit) or adequately decontaminated (below Full Kill limit) conditions. The study reveals a transition zone between these limits, with specific exposure times influencing RLU values. Notably, the defined thresholds provide a clear distinction between decontamination efficacy, aiding in the interpretation of results and decision-making in pharmaceutical manufacturing processes.
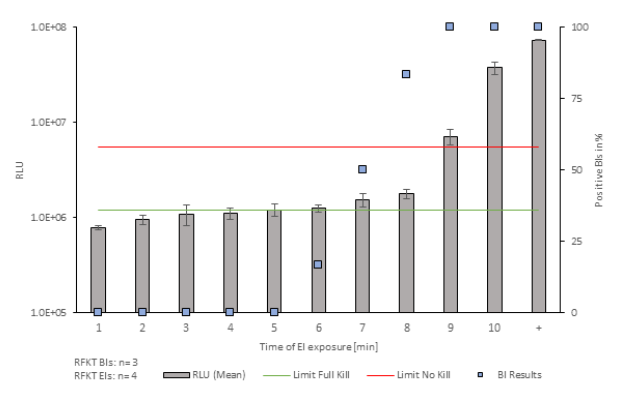
Figure 1: Evaluation of RFKT Studies. The x-axis indicates the time points at which the EIs were exposed to the environment of the isolator. The primary y-axis is representing the mean Relative Light Units of the Eis (n=4). The secondary y-axis displays the percentage of positive Biological Indicators (n=3).

Figure 2: Evaluation of FKT Studies. The x-axis represents the time during which the EIs were exposed to the environment of the isolator. The primary y-axis is representing the mean Relative Light Units of the EIs (n=4). The secondary y-axis displays the percentage of positive Biological Indicators (n=3).
The obtained data result in a correlation of enzymatic activity and BI inactivation for this specific barrier system and decontamination method. It can be used to create a formula for calculation of log reduction for both, RFKT and FKT studies. The previously defined boundaries, Limit Full Kill and Limit No Kill, were determined as a 6-log reduction and 4-log reduction, respectively. Based on these determinations, constants for the following formula were calculated.
Example calculation of log reduction: Formula FKT:
[Equation]
The following formula results from the FKT studies taking into account the utilized system and methodology:
Log reduction=35,815−2,3055 •ln(RLU) (2)
The following formula results from the RFKT studies considering utilized system and methodology:
Log reduction=24,389−1,314 ∙ln(RLU) (3)
These formulas are specific not only for RFKT and FKT studies, but for every barrier system, BI lot, EI lot, decontamination system. The system specific formula can be determined during the gassing cycle development based on FKT data.
DISCUSSION
The results show the development of two different safe methods of fractional studies, which could in principle be used in different barrier systems if handling via gloves inside the system is possible.
Evaluating the RLU values of both studies should be approached differently, given the lower RLU baseline in the FKT studies compared to the RFKT studies. This difference can be attributed to the impact of water on the indicators, which slightly reduced RLUs by partially washing out enzymes. Nevertheless, the EIs remained analyzable and distinguishable, enabling quantitative conclusions about the reductions in FKT studies.
For RFKT studies, the determination of the transition zone's lower boundary faces challenges due to its fluid nature. The transition points of FKT studies are more distinguishable than those in RFKT studies, particularly concerning the Full Kill threshold. The transition in the RFKT studies is less clear, especially in the time points 5 to 8.
The theoretical feasibility of applying FKT studies cannot be transferred to a practical applicability. This method can determine the Full Kill / No Kill limits but only at lower RLU levels. Usually, the EIs are not further treated or transferred into water after a decontamination cycle. Thus, the determination of the limits for EIs transferred into water is still to be improved. The adaptation required for water reduction is not straightforward and may vary across sterilization systems, isolators, EI lots, and BI batches. The adaptation is further complicated by the logarithmic nature of the EI reduction curve.
The adaption of the formulas based on collected data is a promising consideration for practical application. This step is vital for fast recognition and interpretation of results. During the cycle development the focus lies on developing a cycle, that is as short as possible and inactivates all positions, so operates on the border of successful decontamination. An additional safety margin is added in a final step to cover process and starting condition variations leading to ‘overkill’ parameters.
In summary, the practical utilization of enzymatic indicators in the cycle development stage via RFKT is promising. Conducting RFKT studies is crucial for establishing the Full Kill / No Kill limits for each isolator and interpreting future RLU results. EIs allow for a quantitative determination of inactivation at positions compared to traditional cycle development, with a focus on harder-to-deactivate positions. The advantages of EIs lie in gathering immediate results, and enhanced information acquisition resulting in the potential to revolutionize cycle development. However, the use of BIs remains indispensable, serving as the gold standard necessary to validate EI results. The avoidance of viable spores using EIs offers practical benefits, especially during regular requalification. The combined use of EIs and BIs could gain significance in the future, representing a significant advancement in the field of biodecontamination.
ACKNOWLEDGEMENT
Profound thanks are extended to the team of the Aseptic Processing Technologies department for their support and technical assistance, which played a pivotal role in the success of this research.
References
01. Arndt T, "Lexikon der Medizinischen Laboratoriumsdiagnostik," Springer Berlin Heidelberg, 2019, pp. 1535-1535.
02. Chang H-Y and Fu C-Y, Encyclopedia of Food Microbiology (Second Edition), Academic Press, 2014.
03. Hesp JR, Poolman TM, Budge C, Batten L, Alexander F, McLuckie G, O'Brien S, Wells P, Raven NDH and Sutton JM, "Thermostable adenylate kinase technology: a new process indicator and its use as a validation tool for the reprocessing of surgical instruments," Journal of Hospital Infection, pp. 137-143, 2010.
04. Nugent PG, Modi T, McLeod N, Bock LJ, Smith C, Poolman TM, Warburton R, Meighan P, Wells P and Sutton JM, "Application of rapid read-out cleaning indicators for improved process control in hospital sterile services departments," Journal of Hospital Infection, pp. 59-65, 2013.
06. Dawson S and Guest M, How AstraZeneca Optimized Vapor Phase Hydrogen Peroxide Gassing Cycle Development With Enzyme Indicators, Outsourced Pharma, 2021.
06. Scharf B and Kranenburg H, "Enzymatische Indikatoren in H2O2-Bio-Dekontaminationszyklen Teil 2," TechnoPharm, vol. 12, no. 3, pp. 154-159, 2022.
07. Schachtschneider A, Klein S and Marshall K, "Application of Enzyme Indicators in Hydrogen Peroxide Biodecontamination Cycle Development A Critical Evaluation of Indicator Variability and Correlation to Biological Indicator Results," PDA Journal of Pharmaceutical Science and Technology, no. 76, pp. 34-51, 2022.
08. Scharf B and Kranenburg H, "Enzymatische Indikatoren in H2O2-Bio-Dekontaminationszyklen Teil 1," TechnoPharm, vol. 12, no. 2, pp. 84-90, 2022.
Authors
Airin Franke(1),(2), Birte Scharf (3), Karin Mittmann (4), Marina Gole(3)*
1 Aseptic Processing Technologies, Franz Ziel GmbH, Billerbeck, Germany
2 FH Muenster, Engineering Physics, Steinfurt, Germany
3 GMP Compliance, Franz Ziel GmbH, Billerbeck, Germany
4 EUREGIO BioMedtech Center, FH Muenster, Steinfurt, Germany
* Corresponding author: *Marina Gole
Franz Ziel GmbH,
Raiffeisenstr. 33,
48727 Billerbeck,
Germany
Email: marina.gole@ziel-gmbh.com


Comments