

Updated: Sep 24
Peer Review Article | Open Access | Published 29th September 2026 | Submitted 17th June 2026
Comparison of Recombinant Cascade Reagent and Limulus Amebocyte Lysate Assays for the Testing of Pharmaceutical Samples for Bacterial Endotoxins
Melissa J. Cramer¹,*, Courtney E. Snay³, Jennifer W. Dadds¹, Parampal Deol², Allan J. Romberg¹ & Bradley C. Parish¹ | Charles River Laboratories, Massachusetts, & QIAGEN, Germantown, MD, Hanford Pharmaceuticals, NY, United States | EJPPS | 313, (2026) | Cite this article
Abstract
Determining endotoxin levels in pharmaceutical products and medical devices is necessary to minimize the risk of a pyrogenic response and ensure patient safety. For four decades, the Limulus Amebocyte Lysate (LAL) test has been the gold standard for in vitro bacterial endotoxins testing (BET). With sustainability efforts and advancements in technology, recombinant reagents have been developed as alternatives to animal-based tests. Before the LAL test can be replaced, it is key to determine that alternate methods and reagents demonstrate an equivalent performance to FDA-licensed compendial LAL reagents.
This study evaluated the performance of two recombinant cascade reagent (rCR) assays (microfluidic cartridge and microplate) to the respective LAL based assays with pharmaceutically relevant samples. A total of five hundred sixty-three (563) samples were utilized for comparative performance which included interference patterns and samples contaminated with natural environmental endotoxin (NEE). Statistical analysis of 134 endotoxin-positive samples showed that the rCR assays met the pre-defined equivalence criterion of 50-200% but were mostly lower than LAL based on the ratio of geometric means (76.8%). This study utilized a comprehensive real-world dataset, containing naturally contaminated endotoxin samples, which evaluated the performance of rCR methods to traditional licensed LAL reagents.
Keywords: Limulus Amebocyte Lysate (LAL), Recombinant Cascade Reagent (rCR), Bacterial Endotoxins Test (BET)
Introduction
Worldwide, biotechnology companies are driving sustainability initiatives to reduce environmental impact. To guide the welfare of animals used in research, a set of principles known as the 3Rs: Replacement, Reduction, and Refinement were developed by William Russell and Rex Burch1. Alongside these principles, global regulatory bodies are advancing alternative technologies to animal-based tests while ensuring patient safety. The replacement of a critical patient safety test such as the bacterial endotoxins test (BET) must be carefully designed, evaluated, and challenged with a lens of responsibility as a fourth R in addition to the 3R Principles, to further strengthen the animal welfare.
Endotoxin testing is critical in ensuring patient safety for all injectable pharmaceutical products as well as implantable medical devices that encounter the bloodstream or spinal fluid. The current methods utilized for endotoxin testing require the use of animals, either to measure a febrile response (rabbit pyrogen test), allow for gelation (gel-clot), turbidimetric or colorimetric changes (limulus amebocyte lysate) when endotoxin is present. Limulus amoebocyte lysate (LAL) is the primary endotoxin detection method used globally. The essential component of the LAL reagent is the amebocyte (circulating blood cells) which are collected from the blood of horseshoe crabs. Advancements in recombinant science and technology have opened the door to creating animal-free endotoxin detection products2.
Recombinant Cascade Reagent (rCR) uses three recombinant proteins found naturally in Horseshoe Crab for detecting bacterial endotoxins, also known as Lipopolysaccharide (LPS). LPSs are components of the outer membrane of gram-negative bacteria that, when detected by a host’s immune system, can cause a systemic inflammatory response that is initially manifested as fever. The three recombinant factors in this enzymatic cascade are Factor C (rFC), Factor B (rFB), and Proclotting enzyme (rPCE)3. As serine protease-like zymogens, Factor C, Factor B, and the pro-clotting enzyme must be activated to form the enzymatic cascade. Factor C is autocatalytically activated in the presence of LPS. The resulting activated Factor C then activates Factor B, which then activates the pro-clotting enzyme3,4. In the presence of a colorless substrate, the enzymatic reaction will cause a yellow color to develop upon cleavage of the chromophore, p-nitroaniline (pNA). The cleavage of pNA is measured spectrophotometrically through absorbance at 405 nm5.
Several studies have shown that endotoxin detection methods differ in their ability to detect naturally occurring endotoxin (NOE) versus commercially available purified LPS such as reference standard endotoxin (RSE) and control standard endotoxin (CSE)6,7,8,9. These differences can be attributed to the fact that RSE and CSE consist of a purified LPS which, due to degradative effects caused by the hot-phenol extraction, will be lacking in structural similarity to LPS produced by bacteria. While NOEs more closely represent endotoxin structures that are typically detected in a manufacturing environment when compared to purified LPS, there are still significant differences. NOEs are isolated from a pure culture of bacteria that is grown in media within a laboratory environment, whereas the endotoxin structures produced by bacteria found in water pre-treatment systems, raw materials, in-process intermediates, and final products are not isolated and will most likely be from a mixed culture. These endotoxins are called natural environmental endotoxins (NEE) and are accountable for the majority of endotoxin-positive samples10. NEEs are produced by gram-negative bacteria and occur naturally within the manufacturing environment; they are often generated by organisms that cannot be recovered or cultured from real-world samples. In addition to LPS, NEEs also contain other parts of the gram-negative bacteria outer cell membrane such as carbohydrate, peptidoglycan, and other proteins7,8. In the pharmaceutical industry, water is one of the most common potential sources for NEE as gram-negative bacteria have adapted over time to survive and even reproduce in these low nutrient environments11. As such, when developing a new method for endotoxin detection, such as recombinant cascade reagent (rCR), it is critical to test pharmaceutical samples that contain NEE in addition to commercially available LPS products7.
This study was designed to compare an rCR assay to biological LAL reagents (chromogenic or turbidimetric) by evaluating the detection of NEEs in pharmaceutically relevant samples. Samples or testing results were received from a geographically diverse set of participants to ensure that a variety of bacteria were included in the study12. It is well known that different geographic locations will have distinct microbial characteristics. These differences are most likely due to environmental factors such as temperature, pH, and bio-available dissolved organic carbon13,14. These samples included endotoxin positive and negative samples and provided a wide range of potential interfering compounds to challenge the ability of rCR to perform comparably to biological LAL reagents. Five-hundred sixty-three (563) samples were included in the study, two-hundred forty (240) were tested with microplate assays and three-hundred twenty-three (323) with microfluidic cartridge assays. All samples positive for endotoxin were a result of NEE as none of the samples were spiked with NOE, RSE or CSE. A statistical evaluation for equivalence was used to compare the rCR to the FDA-licensed LAL reagent.
Materials and Methods
Collection of samples and data
Study participants could contribute to a comparative study of rCR to FDA-licensed LAL methods in two ways; 1. Submission of samples or 2. Submission of paired data. Those that chose to submit samples of products to be included in the study sent the samples to Charles River facilities in Charleson, South Carolina; Singapore; Songdo, Republic of Korea; Zhanjiang, China; or Shanghai, China. Upon receipt, all containers were inspected for integrity and immediately transferred to the study participants’ specified storage conditions. Each sample was numbered and recorded in a project specific database to ensure chain of custody was maintained. Additionally, commonly available veterinary injectables were sourced from local animal supply sources to be included in the study.
Participants that chose to submit data were provided with either Trillium (Charles River Laboratories, Inc., Charleston, SC) Recombinant Cascade Reagent (rCR) vials for microplates or Trillium (Charles River Laboratories, Inc., Charleston, SC) Recombinant Cascade Reagent (rCR) microfluidics cartridges. If requested, Limulus Amebocyte Lysate Endosafe® Endochrome-K™ (Charles River Laboratories, Inc., Charleston, SC), Endosafe® LAL Cartridges (Charles River Laboratories, Inc., Charleston, SC), and/or Beta Glucan Blocker (Charles River Laboratories, Inc., Charleston, SC) were also provided as the comparator. Participant testing was performed following a statement of work.
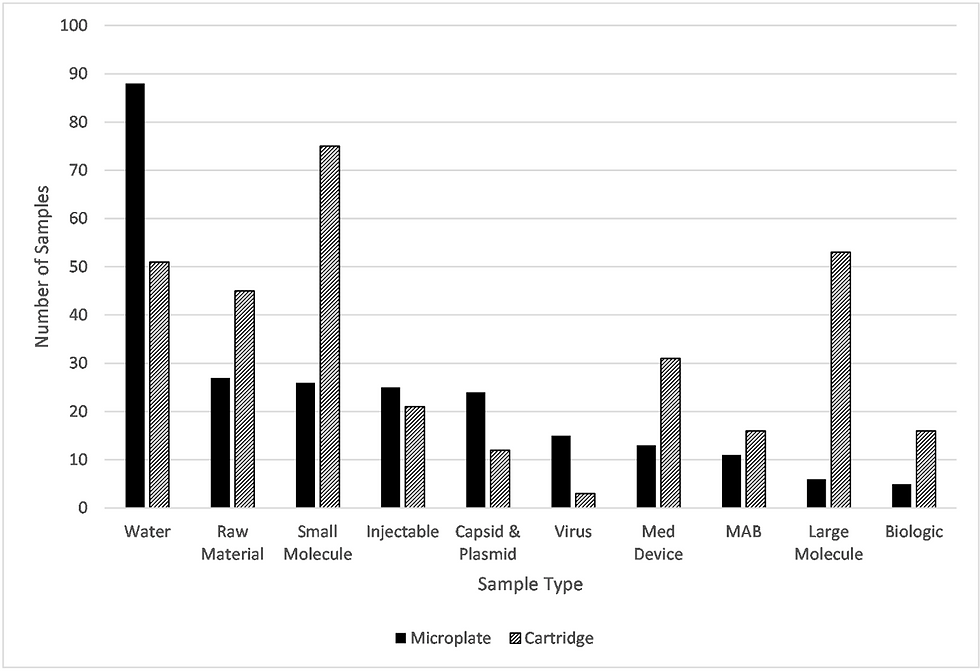
A total of two hundred forty (240) samples were obtained from North America, Europe, Asia, and Oceania for microplate testing, and three hundred twenty-three (323) samples were obtained from North America, South America, Europe, Asia, and Oceana for cartridge testing (Figure 1). Microplate assay samples consisted of water, raw materials, small molecules, injectables, capsids or plasmids, adenovirus, lentivirus, medical devices, monoclonal antibodies, large molecules, and biological samples (Figure 2). For cartridges, the samples were composed of small and large molecules, water, raw materials, medical devices, injectables, biologics, monoclonal antibodies, capsid or plasmid and adenovirus and lentivirus (Figure 2).

Endotoxin analysis - Microplate Based Assay
All samples were tested following each participant’s validated LAL methods. If unacceptable positive product control (PPC) recovery (less than 50% or greater than 200%) was seen at the validated method when using rCR, it was acceptable for additional dilutions to be performed and tested until acceptable results were seen, not to exceed the Maximum Valid Dilution (MVD) or Minimum Valid Concentration (MVC). It is critical not to exceed the MVD, and not to fall below the MVC as these are the maximum allowable sample dilution and the minimum concentration at which the endotoxin limit can be determined. All data had to meet this criterion for inclusion in the study.
Samples received were simultaneously tested for endotoxin by contract laboratory services provided by the manufacturer (Charles River Laboratories, Inc.) using Kinetic Chromogenic or Turbidimetric LAL methods (KCA or KTA) and Recombinant Cascade Reagent (rCR) and compared to a 5 – 0.005 EU/mL RSE standard curve. KCA was rehydrated with 3.2 mL of Beta-Glucan Blocker (Charles River Laboratories, Inc., Charleston, SC) and KTA with 5.2 mL. Beta-Glucan Blocker was used to reduce and/or eliminate the interference that may be caused through the β-D-Glucan alternative pathway. rCR was reconstituted with 1.7 mL of LAL Reagent Water (LRW) instead of Beta-Glucan Blocker because rCR lacks factor G, a critical component in the β-D-Glucan pathway. Standards and test samples were assayed by transferring one hundred (100) microliter aliquots for KCA and KTA or fifty (50) microliter aliquots for rCR to polystyrene tissue culture-treated plates (Corning Incorporated, Durham, NC) followed by the addition of the respective endotoxin detection reagents. Each sample (or a dilution of the test sample) was examined in duplicate along with a duplicate positive product control. Each well was measured at 405 nm for chromogenic reagents and 340 nm for turbidimetric reagents every 30 seconds using an incubating absorbance reader (Bio-Tek ELx808). All plates were incubated at 37°C until the lowest standard (0.005 EU/mL) crossed a defined change in absorbance (delta optical density (OD)). The delta OD for both LAL and rCR methods was 0.1 absorbance units. All data were analyzed via endotoxin detection software (EndoScan-V version 6.2.0). A linear regression of log onset time against log endotoxin concentration was used to interpolate sample concentrations.
Endotoxin analysis - Cartridge Based Assay
Like microplate assays, at participants’ sites, all samples were tested as per validated microfluidic cartridge LAL methods. Additional dilutions were performed if needed based on the rCR results and tested until acceptable results were seen, not to exceed the MVD / MVC. All data were checked for validity prior to analysis.
All the testing for microfluidic cartridges performed by contract laboratory services was conducted following a pre-approved quality assurance protocol. Each sample was diluted a minimum of 50% with Beta Glucan Blocker for LAL cartridges or LRW for rCR cartridges. Both LAL and rCR cartridges were at a sensitivity of 1.0 – 0.01 EU/mL. Twenty-five (25) microliter aliquots of each sample (or a dilution of the test sample) were loaded into the four sample reservoirs of the cartridge. The reader draws and mixes the sample with the LAL or rCR reagents in two wells and positive product control in the other two wells. The sample is then incubated at 37°C inside the cartridge reader. After mixing and incubation, the optical density of the wells was measured and analyzed against an internally archived standard curve. The archived standard curve specific to each batch of cartridges is constructed through testing performed against RSE as part of release testing at the manufacturer using the log of the reaction time against the log of the concentration. The sample and spike values are calculated by interpolation of the standard curve using the reaction times. The system simultaneously performs testing in duplicate and averages the results. All data were analyzed via endotoxin detection software (EndoScan-V version 6.2.0).
Data review and Statistical Analysis
All data, whether generated internally or externally, were subjected to data acceptance criteria under a pre-approved quality assurance protocol. These criteria were: must have paired data, correlation coefficient (linearity) greater than the absolute value of 0.980, spike recovery in the PPC between 50 – 200% and the coefficient of variation between endotoxin standard replicates as well as sample replicates less than 10% for microplate assays and less than less than 25% for cartridges.
Once the data were accepted, they were reviewed independently by a statistician to ensure there were no missing data points or potential outliers, and exploratory plots were created. The data sets were then transferred to a data analysis software (SAS® version 9.4) database which was locked prior to statistical analysis and appropriate descriptive statistics were calculated and tabulated.
The two one-sided test (TOST) method for testing equivalence of the rCR and LAL methods was performed using an ANOVA model for repeated measures after natural logarithmic transformation of the endotoxin values. A compound symmetry variance-covariance matrix was selected based on the Akaike Information Criterion (AIC), a mathematical method for evaluating how well a model fits the data it was generated from. The adequacy of this model was checked by analyzing the residuals and the natural logarithmic transformation of the endotoxin values was applied to improve the normality of the residuals. The difference between the rCR and LAL methods and the two-sided 90% confidence interval were calculated. These were then back transformed using the anti-log to provide an estimate of the ratio of geometric means and the 90% confidence interval. This confidence interval was used to assess equivalence of rCR and LAL. If the confidence interval was contained entirely within the equivalence interval of (50%, 200%), equivalence was demonstrated.
Two one-sided tests assessed equivalence at α = 0.05, corresponding to a two-sided 90% confidence interval. All statistical analyses were performed in SAS® (Version 9.4).
Results
Measured Endotoxin Activity and Analysis
In total, five-hundred sixty-three (563) samples were tested with both FDA-licensed LAL methods and rCR. Two hundred forty (240) of those were tested using the microplate assays and three-hundred twenty-three (323) were tested using the cartridge-based assays. A breakdown of the endotoxin results for all samples is shown in Table I. Approximately 68% and 75% of the samples for microplate and cartridge assays respectively demonstrated endotoxin values below the assay sensitivity for both LAL and rCR methods. Twenty-six percent (n = 63) of microplate samples and twenty-two percent (n = 71) of cartridge samples demonstrated measurable endotoxin and were utilized in further analysis. A small set of samples, 6% (n = 15) for microplate and 3% (n = 10) for cartridges, showed discordant results.
Overall, the sample agreement between the LAL and rCR was 94% and 97% for microplate and cartridge assays respectively, and overall agreement for samples from both methods was 96%. The analysis of discordant samples revealed three different categories: inconclusive, rCR underpredicted or interference from the sample (Tables II-IV). The majority of samples yielding discordant results (67% of 6% (10/15) for microplate and 70% of 3% (7/10) for cartridge samples) were extremely complex in nature, such as enzymes, plasmid, capsid, or monoclonal antibodies.
Table 1: Summary of all samples broken down by endotoxin result
Assay Type | Endotoxin Positive for rCR and LAL (%) | Endotoxin Negative for rCR and LAL (%) | Discordant Results (%, either rCR positive or negative or vice versa) |
Microplate | 26 | 68 | 6 |
Cartridge | 22 | 75 | 3 |
Table 2: Inconclusive results for endotoxin
Assay Type | Sample Type | LAL | rCR |
Endotoxin Value (EU/mL) | Endotoxin Value (EU/mL) | ||
Cartridge | Monoclonal Antibody† | 0.327 | <0.200 |
Enzyme† | 1.83 | <1.00 | |
1.11 | <0.500 | ||
1.22 | <0.500 | ||
Vaccine | 0.901 | <0.500 | |
Microplate | Capsid | 0.0526 | <0.05 |
Plasmid
| 0.1 | <0.05 | |
0.0591 | <0.05 | ||
0.0518 | <0.05 | ||
0.057 | <0.05 | ||
0.0706 | <0.05 | ||
0.0614 | <0.05 | ||
Vaccine† | <0.5000* | 1.3685 | |
Medical Device Extraction† | <0.0500 | 0.0754 | |
Poloxamer† | 0.0676 | <0.0500 | |
Monoclonal Antibody† | 0.389 | <0.250 | |
0.389 | <0.250 | ||
0.415 | <0.250 | ||
Raw Material | <0.2500 | 1.2323 |
* Indicates LAL testing was KTA
† Indicates data submitted by participant
Table 3: rCR underpredicted endotoxin
Assay Type | Sample Type | LAL | rCR |
Endotoxin Value (EU/mL) | Endotoxin Value (EU/mL) | ||
Cartridge | Medical Device Extraction† | 1.56 | <0.050 |
0.164 | <0.050 | ||
Enzyme | 6.4 | <1.00 | |
9.04 | <1.00 | ||
1.5 | <0.500 |
† Indicates data submitted by participant
Table 4: Sample with interference for rCR assay
Assay Type | Sample Type | LAL | rCR |
Endotoxin Value (EU/mL) | Endotoxin Value (EU/mL) | ||
Microplate | Large Molecule† | 0.00795* | <0.1250 |
* Indicates LAL testing was KTA
† Indicates data submitted by participant
Endotoxin Data Analysis
The endotoxin positive samples were geographically diverse and comprised of a distribution of multiple matrices for both microplate and cartridge assays (Figures 3 & 4). The endotoxin positive samples originated from North America, EU, Asia, and Oceania for both microplates and cartridges (Figure 3).
There was a diverse distribution of sample types for the endotoxin positive samples ranging from pharmaceutical waters, injectables, small molecules, and monoclonal antibodies for both assay types as shown in Figure 4. All sample types were represented for microplate and cartridge assays, except large molecules and medical devices for microplates and raw materials and adenovirus/lentivirus for cartridges.


A summary of the endotoxin testing results for microplate samples is shown in Table V and cartridge samples in Table VI. The data were grouped based on ranges of endotoxin levels and separated by test type. The distribution of the samples for both FDA-approved LAL methods and rCR were observed to be remarkably similar across the entire endotoxin range, indicating good agreement between the natural LAL and recombinant methods.
Table 5: Summary of Detected Endotoxin Values in Microplate Samples for Statistical Analysis
Endotoxin Range (EU/mL) | Number of Samples | |
FDA-licensed LAL | rCR | |
0.01 – 1.0 | 23 | 22 |
1.0 – 10 | 15 | 16 |
10 – 100 | 12 | 12 |
100 – 1000 | 7 | 9 |
> 1000 | 6 | 4 |
Total | 63 | 63 |
Table 6: Summary of Detected Endotoxin Values in Cartridge Samples for Statistical Analysis
Endotoxin Range (EU/mL) | Number of Samples | |
FDA-licensed LAL | rCR | |
0.01 – 1.0 | 11 | 10 |
1.0 – 10 | 24 | 26 |
10 – 100 | 9 | 10 |
100 – 1000 | 14 | 16 |
> 1000 | 13 | 9 |
Total | 71 | 71 |
Correlation of LAL and Recombinant Reagents
The results from LAL and rCR testing were compared and shown as scatter plots (Figures 5 & 6). The rCR reagents demonstrate excellent agreement to the LAL reagents (Microplate R2 = 94.8%, Cartridge R2 = 97.2%). The mean of the samples was 0.770 for LAL and 0.620 for rCR with a standard deviation of 1.385 for LAL and 1.379 for rCR for microplate assays while the mean of samples tested for cartridges was 1.432 for LAL and 1.349 for rCR with a standard deviation of 1.614 for LAL and 1.605 for rCR. Given the accepted margin of error within LAL and endotoxin testing, this data indicates that the rCR microplate and cartridge assays have a strong correlation to the LAL microplate and cartridge assays.


Statistical Analysis
All samples that demonstrated an endotoxin positive result for both rCR and natural LAL were included in the TOST statistical analysis to determine the overall performance and equivalence of the recombinant methods. The data in Tables VII & VIII demonstrates that the 90% confidence interval for rCR compared to LAL (69.7%, 84.6%) was contained entirely within the equivalence interval of (50%, 200%), it was concluded that rCR is equivalent to LAL.
Table 7: Summary Statistics of Endotoxin Results (EU/mL) by Method
Method | n | Mean | Geometric Mean | SD | Min | Median | Max |
rCR | 134 | 5063 | 10.1 | 37207 | 0.0108 | 3.95 | 413637 |
LAL | 134 | 5053 | 13.2 | 37893 | 0.0127 | 5.61 | 427219 |
Table 8: TOST Analysis of Endotoxin Results (after Natural Logarithmic Transformation)
Comparison | DF | Ratio of Geometric Means | 90%Confidence Interval | Equivalent |
rCR vs LAL | 133 | 76.8% | (69.7%, 84.6%) | Yes |
Discussion & Conclusion
This study was designed to challenge an rCR method while increasing the understanding of the performance of this method with pharmaceutically relevant samples that contained real-world NEEs. It was important to collect these real-world samples with and without detectable endotoxin values (Figures 1 & 2 and Table I) to ensure the sampling was representative of what is seen in a pharmaceutical manufacturing setting. In addition to acquiring samples with and without NEE, a significant effort was made to collect sufficient data with global diversity where at least twenty percent of total samples were endotoxin positive to evaluate equivalency between rCR method relative to the LAL method (Figures 3 & 4). As the manufacturing processes by the pharmaceutical industry are controlled to comply with regulatory standards, most of the samples are expected to be below the detectable endotoxin level. This was evident by the data presented in this study (Table I) with 68-75% of samples testing negative for the presence of endotoxin. However, 22-26% of the samples showed endotoxin positive values depending upon the assay type for both LAL and rCR methods and met the BET criteria to comply with USP <85>, EP 2.6.14, ANSI/AAMI ST72 and USP <86> respectively15,16,17,18. A small percentage of samples showed discordant results which may have been due to being comprised of complex matrices where biological fluctuations for any endotoxin detection method are expected. Each of these samples were scrutinized during data analysis to ensure understanding behind the discrepancy. For water, the simplest test matrix, no discordant results were observed.
A discrepant result was classified as inconclusive when one assay (LAL or rCR) delivered an endotoxin result, and the other assay failed to detect endotoxin as indicated by a less than (<) result. In this study, nineteen (19) samples were found to have inconclusive endotoxin results (Table II). Upon further analysis of the data, it was found that typically the assay that provided a value for endotoxin was very close to the limit of detection for the assay. For example, the capsid sample tested with the microplate assay had an endotoxin value for LAL of 0.0526 EU/mL and <0.05 EU/mL for the rCR assay. While not acceptable for direct comparison because one of the assays reported less than lambda, the results are not considered significantly different. Therefore, the results from the samples in Table II can be considered comparable.
Endotoxin testing results for five samples demonstrated that the amount of endotoxin present was underpredicted by rCR when compared to LAL (Table III). For the medical device extraction samples, that were originally tested using cartridges, microplate LAL data was also provided and showed an endotoxin value of <0.050 EU/mL. Consultation with the laboratory that performed the testing found that a glucan blocking buffer was used to perform the microplate LAL testing but not the cartridge LAL testing. This was important to note that rCR is not reactive to the β-D-Glucan alternative pathway as it lacks factor G, a critical component in the pathway. As such, it was concluded that these samples were contaminated with glucan and did not contain greater than 0.05 EU/mL endotoxin; therefore, the rCR assay delivered accurate results for these two samples. The other three samples in Table III are enzymes which can be complicated to test as they are present in a complex biological matrix. The performance of many types of assays can be affected by complex samples, and endotoxin testing is no exception; however, out of five-hundred sixty-three (563) samples only three (3) samples had unexplained underprediction which is less than 1% of the samples tested. This is an exceptionally low percentage of underprediction. For this study the focus was to obtain results from a wide variety of samples contaminated with NEEs as well as to look at interference patterns (samples that demonstrated endotoxin values below the assay sensitivity) rather than the validation of sample preparations. As such, additional method development efforts would be warranted for these samples to obtain validated preparation methods.
The final sample with discrepant results was due to interference from the sample matrix (Table IV). This particular sample required additional dilution when used with rCR to obtain a passing spike value. Ultimately, the additional dilution resulted in the inability of rCR to detect the low-level endotoxin that was detected by LAL. This interference is most likely due to the nature of the sample; many large molecules are comprised of a complex biological matrix which can interfere with the detection of endotoxin. It is possible that additional method development beyond sample dilution could have mitigated the interference mechanism observed in this study.
Eleven (11) other samples included in the study also demonstrated interference and required additional dilution for one of the assay types (LAL or rCR) to overcome this interference. These samples were not included in Table IV as they did not yield discrepant results despite additional dilutions. For LAL, three (3) samples required further dilution to achieve results that passed BET acceptance criteria for microfluidic cartridges. The rCR microplate assay had one (1) sample that required additional dilution, and the microfluidic cartridge assay had seven (7) samples that required further dilution to pass the BET acceptance criteria. Many of these samples were products with complicated matrices such as small molecules, vaccines, and media. The results showing interference demonstrate the importance of performing method suitability testing for any sample that will be evaluated via endotoxin testing. This ensures that any inhibition or enhancement from the sample are characterized to avoid over or under prediction of endotoxin values due to interfering factors that can be present in the sample matrices19.
Additional dilution was required infrequently for both methods (3 samples for LAL and 8 for rCR out of 563 total samples). This supports that the alternate rCR methods are a viable option as a replacement for current LAL methods.
Prior to statistical analysis, data were further parsed based on endotoxin values in the samples to compare rCR microplate and microfluidics cartridges with respective LAL tests (Tables V and VI). A strong correlation was demonstrated with both rCR reagents with the FDA-licensed LAL reagents (Figures 5 & 6). An independent statistical analysis concluded equivalence of rCR reagents to LAL reagents (Tables VII and VIII), for all endotoxin positive samples using the TOST method. These samples demonstrated a high level of correlation between the two methods, R2 = 97.2% for cartridge assays and 94.8% for microplate assays. An external statistical analysis demonstrated that the rCR assay when compared to the LAL assays met the pre-defined equivalency criteria of 50-200%. The results presented here demonstrate that rCR methods (microplate assay and microfluidic cartridges) are generally suited for a wide variety of pharmaceutically relevant samples and demonstrate equivalent performance to FDA licensed compendial LAL reagents.
Conflict of Interest Declaration
There are no known competing financial interests or personal relationships that could have appeared to influence the work reported in this paper.
References
1. Hubrecht R. C. and Carter E. (2019) The 3Rs and Humane Experimental Technique: Implementing Change. Animals 9:754. doi: 10.3390/ani9100754
2. Gorman R. (2020) Atlantic Horseshoe Crabs and Endotoxin Testing: Perspectives on Alternatives, Sustainable Methods, and the 3Rs (Replacement, Reduction, and Refinement). Front Mar Sci 7:1-11. doi: 10.3389/fmars.2020.582132
3. Iwanaga S., Miyata T., Tokunaga F. and Muta T. (1992) Molecular Mechanism of Hemolymph Clotting System in Limulus. Thromb Res 68:1-32. doi: 10.1016/0049-3848(92)90124-s
4. Shibata T., Kobayashi Y., Ikeda Y. and Kawabata S. (2018) Intermolecular Autocatalytic Activation of Serine Protease Zymogen Factor C Through an Active Transition State Responding to Lipopolysaccharide. J Biol Chem 293 (29): 11589–11599. doi: 10.1074/jbc.RA118.002311
5. Nakamura S., Morita T., Iwanaga S., Niwa M. and Takahashi K. (1977) A sensitive substrate for the clotting enzyme in horseshoe crab hemocytes. J Biochem 81: 1567-1569. Online ISSN: 1756-2651
6. Bowers K. and Tran L. (2011) Creation of an In-house Naturally Occurring Endotoxin Preparation for Use in Endotoxin Spiking Studies and LAL Sample Hold Time Analysis. Am Pharm Rev 14 (6): 21-23. https://www.acciusa.com/pdfs/supplements/Endotoxin%20Detection%20Part%20I/Creation%20 of%20an%20In-house%20-%20Bowers.pdf. Accessed 08 October 2025
7. Cooper J. (2016) Some Thoughts on USP’s New NOE Standard. PDA Letter 52 (10): 28.
8. Tirumalai R., Hussong D., Akers J. and McCullough K. (2016) USP Perspectives on LAL Assay Interference and NOE Standard. PDA Letter. 52 (10), 22–26.
9. Tirumalai R. S. (2016) Naturally Occurring Endotoxin: A New Reference Material Proposed by the US Pharmacopeia. Am. Pharm. Rev. Endotoxin Supplement, 12–15.
10. Wachtel C., and Dubczak J. (2024). The Spectrum of Endotoxins: From Standards to Natural Variants. MS-24-Endo-The-Spectrum-of-Endotoxins-RSE-vs-CSE-vs-NOE-vs-NEE.pdf. Accessed 08 October 2025
11. Sandle T. (2024) Sink or Swim: Seeking Endotoxin Control in Pharmaceutical Water Systems. Microbiology News. https://www.linkedin.com/pulse/sink-swim-seeking-endotoxin-control-pharmaceutical-tim-e32ne/. Accessed 08 October 2025
12. Sandle, T. (2022) Walk on the Wild Side: The Application of Environmental Isolates in Microbiological Testing. Eur J Parenter Pharm Sci doi: 10.37521/ejpps.27104
13. Ma B., LaPara T. M., Evans A. N., and Hozalski R. M. (2020) Effects of geographic location and water quality on bacterial communities in full-scale biofilters across North America. FEMS Microbiol Ecol 96, 1-9. doi: 10.1093/femsec/fiz210
14. Zhou W., Li W., Chen J., Zhou Y., Wei Z. and Gong L. (2021) Microbial Diversity in Full-scale Water Supply Systems Through Sequencing Technology: A Review. RSC Adv 11, 25484-25496. doi: 10.1039/D1RA03680G
15. U.S. Pharmacopeial Convention. (2019). Chapter <85> Bacterial Endotoxins Test. In USP-NF. Retrieved August 20, 2026, from https://doi.org/10.31003/USPNF_M98830_02_01
16. European Pharmacopoeia Commission. European Pharmacopoeia 10th ed., Chapter 2.6.14, “Bacterial Endotoxins”. 2019. Directorate for the Quality of Medicines & HealthCare (EDQM), Council of Europe, Strasbourg, France.
17. Associate for the Advancement of Medical Instrumentation. (2019). Bacterial endotoxins-Test methods, routine monitoring, and alternatives to batch testing (ANSI/AAMI ST72:2019). Arlington, VA.
18. U.S. Pharmacopeial Convention. (2025). Bacterial Endotoxins Test Using Recombinant Reagents (General Chapter <86>). In USP-NF. Retrieved August 20, 2026), from https://doi.org/10.31003/USPNF_M16015_02_01
19. Bolden J, Smith K (2017) Application of Recombinant Factor C Reagent for the Detection of Bacterial Endotoxins in Pharmaceutical Products. PDA J Pharm Sci Technol 71(5), 405-412. doi: 10.5731/pdajpst.2017.007849
Author information
Corresponding Author: Melissa J Cramer
Charles River Laboratories, Massachusetts, United States
Email: missy.cramer@crl.com
Telephone: +1 (803) 553-0681
Authors: Melissa J. Cramer¹,*, Courtney E. Snay³, Jennifer W. Dadds¹, Parampal Deol², Allan J. Romberg¹ & Bradley C. Parish¹
Charles River Laboratories, Charleston, SC
QIAGEN, Germantown, MD.
Hanford Pharmaceuticals, Syracuse, NY



Comments